
Psychometric Scale Development with the PsychtrixWeb Scale Sandbox
Abstract
Many psychological and educational scales are built with general survey tools that collect responses well but leave every psychometric decision to separate software and to the researcher's memory of best practice. This paper sets out the established stages of scale development, from construct definition through item generation, content validation, pilot testing, item analysis, factor analysis, reliability, validity and norming. It then describes the Scale Development Sandbox in PsychtrixWeb, a free, browser-based psychometric platform, and shows how its workflow maps onto each stage. The sandbox combines a construct, dimension and item hierarchy, reverse-score flags, grouping variables for differential item functioning (DIF) and measurement invariance, shareable anonymous survey links and one-click analysis that reports Cronbach's alpha with a bootstrap confidence interval, McDonald's omega, split-half reliability, corrected item-total correlations, alpha-if-item-deleted, the standard error of measurement, floor and ceiling effects and percentile norms. A feature comparison with Google Forms, Microsoft Forms and KoboToolbox shows that the general tools match or exceed the sandbox on data collection, but none of them carries the measurement model or computes any psychometric statistic. The paper argues that keeping design, collection and analysis in one environment reduces avoidable error, shortens the development cycle and makes good measurement practice easier to follow, particularly for students and researchers in low-resource settings. Limitations and recommendations for use are discussed.
1. Introduction
Measurement is the foundation on which every substantive finding in the behavioural sciences rests. If a scale does not measure what it claims to measure, or measures it with too much error, then correlations, group differences and path coefficients built on it are uninterpretable, however sophisticated the later statistics (Flake & Fried, 2020). The Standards for Educational and Psychological Testing make the same point: validity is "the most fundamental consideration in developing tests and evaluating tests" and must be supported by accumulated evidence rather than assumed (American Educational Research Association [AERA] et al., 2014).
Despite this, reviews of published research repeatedly find weak measurement practice. Flake et al. (2017) examined scales used in a leading social and personality journal and found that many were reported with little validity evidence beyond a single alpha coefficient, and that a considerable number were created on the spot without any reported development. Worthington and Whittaker (2006) reached similar conclusions for counselling psychology, noting frequent problems with sample size, factor retention decisions and the reporting of item selection. Flake and Fried (2020) describe these as "questionable measurement practices": undisclosed or poorly justified decisions about how a construct is operationalised and scored.
Part of the problem is practical. Researchers, especially postgraduate students, commonly build their instrument in a general form builder such as Google Forms, Microsoft Forms or KoboToolbox, export a spreadsheet, recode reversed items by hand, move the file into SPSS, R or another package, and then attempt the analyses. Each hand-off is an opportunity for error, and none of these form tools knows that the questions belong to constructs and dimensions, that some are reverse-keyed, or that a demographic variable will later be used to test invariance.
This paper has three aims. First, it summarises the stages of scale development recommended in the methodological literature. Second, it describes the Scale Development Sandbox in PsychtrixWeb (PsychTrix Innovative, n.d.; Oladunmoye, 2026a,b) and shows how its workflow supports those stages. Third, it compares the sandbox with three widely used general data collection tools and sets out the justification for, and limits of, using a dedicated psychometric environment.
2. Principles of Scale Development
Scale development is iterative rather than linear: a weakness found at a late stage usually sends the developer back to rewrite items and collect new data. Figure 1 summarises the widely cited three-phase model of Boateng et al. (2018), extended with the norming step stressed by the Standards (AERA et al., 2014; Oladunmoye, 2026c).
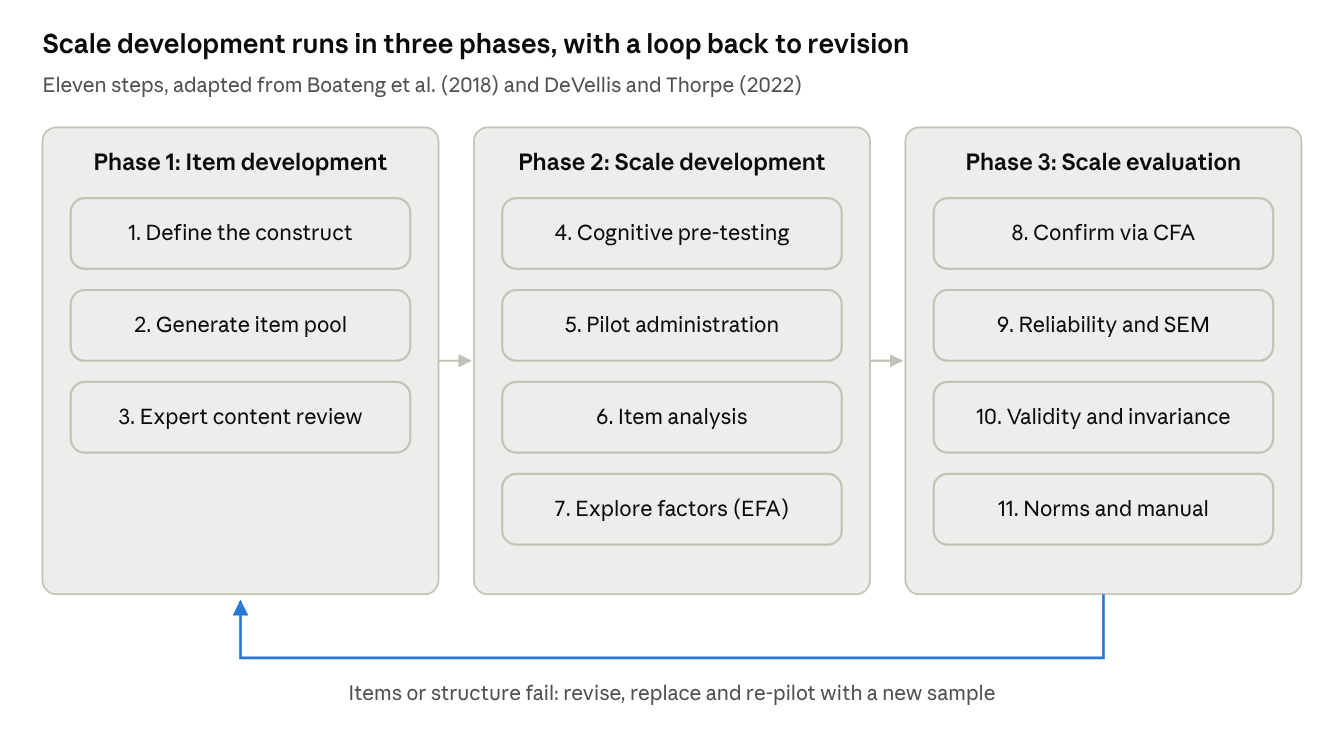
Figure 1. Phases and steps of scale development
2.1 Defining the construct
Every good scale begins with a clear, written definition of what it measures, what it does not measure, and how the construct relates to neighbouring constructs (Clark & Watson, 1995, 2019). The definition should state whether the construct is unidimensional or has distinct facets, because this decides the item hierarchy and later the factor model. A review of theory and existing instruments also confirms that a new scale is needed at all; adapting a sound existing measure is often the better choice (Beaton et al., 2000).
2.2 Generating the item pool
Items may be drawn deductively from theory and literature, or inductively from interviews, focus groups and open-ended responses with the target population (Hinkin, 1998). The initial pool should be considerably larger than the intended scale, commonly three to four times the final length, so that weak items can be dropped without losing coverage (DeVellis & Thorpe, 2022; Oladunmoye, a,b,c,d). Items should be short, written at the reading level of respondents, free of double negatives and double-barrelled wording, and should include some reverse-keyed items to reduce acquiescence, provided they are not confusing.
2.3 Content validity
A panel of subject experts rates each item for relevance and clarity. Two common indices are Lawshe's (1975) content validity ratio (CVR) and the item-level content validity index (I-CVI), the proportion of experts who rate an item 3 or 4 on a four-point relevance scale (Polit & Beck, 2006).
Here n_e is the number of experts rating the item "essential" and N is the panel size. With six or more experts, an I-CVI of at least 0.78 and a scale-level average (S-CVI/Ave) of at least 0.90 are usually recommended (Polit & Beck, 2006).
2.4 Pre-testing and pilot administration
Cognitive interviews with a handful of target respondents reveal items that are misread or interpreted differently from the developer's intention. The revised pool is then administered to a pilot sample. Guidance on sample size varies, but at least 10 respondents per item, and preferably 200 to 300 in total, is a common rule for factor-analytic work (Boateng et al., 2018; Costello & Osborne, 2005; Oladunmoye & Muhammad, 2024).
2.5 Item analysis and reduction
Classical test theory (CTT) statistics identify items that do not belong. Corrected item-total correlations below about 0.30 suggest an item measures something different from the rest (Nunnally & Bernstein, 1994; Oladunmoye, 2026a,c&e). Alpha-if-item-deleted shows whether dropping an item would improve internal consistency. Item means and response distributions show items that almost everyone endorses or rejects. Item response theory (IRT) adds discrimination and threshold parameters that describe where on the trait each item is most informative.
2.6 Dimensionality
Exploratory factor analysis (EFA) on the pilot data suggests how many factors underlie the items; parallel analysis is preferred to the eigenvalue-greater-than-one rule (Horn, 1965; Costello & Osborne, 2005). Items with weak primary loadings (below about 0.40) or substantial cross-loadings are candidates for removal (Hinkin, 1998). Confirmatory factor analysis (CFA) on a fresh sample then tests the retained structure. Hu and Bentler (1999) proposed cut-offs of CFI and TLI close to 0.95, RMSEA close to 0.06 and SRMR close to 0.08.
2.7 Reliability
Cronbach's (1951) alpha remains the most reported index, but it assumes equal loadings (tau-equivalence) and can misstate reliability when that assumption fails. McNeish (2018) therefore recommends reporting McDonald's (1999) omega alongside or instead of alpha. Values of 0.70 or above are generally acceptable for research use (Nunnally & Bernstein, 1994). The standard error of measurement (SEM) converts reliability into score units and is needed to interpret an individual's score:
Test-retest reliability, usually an intraclass correlation of at least 0.70, establishes stability over time (Terwee et al., 2007). Floor or ceiling effects are considered present when more than 15% of respondents obtain the lowest or highest possible score (Terwee et al., 2007; Oladunmoye, 2026f).
2.8 Validity, invariance and norms
Validity is a unified judgement built from several sources of evidence (Messick, 1995). Convergent and discriminant evidence come from correlations with related and unrelated measures (Campbell & Fiske, 1959), from average variance extracted of at least 0.50 (Fornell & Larcker, 1981) and from heterotrait-monotrait ratios below 0.85 (Henseler et al., 2015). Criterion evidence comes from relationships with outcomes the scale should predict. Before groups such as men and women or different countries are compared, measurement invariance must be shown through configural, metric and scalar models, with a change in CFI of no more than 0.01 a common criterion (Cheung & Rensvold, 2002; Putnick & Bornstein, 2016; Oladunmoye, 2015; 2025). DIF analysis tests the same question item by item (Holland & Wainer, 1993; Oladunmoye, 2026c&d). Finally, norms such as percentiles from a representative sample allow individual scores to be interpreted.
Table 1 gathers the benchmarks most often used at each stage.
Table 1. Common psychometric benchmarks in scale development
Stage | Indicator | Common benchmark | Source |
|---|---|---|---|
Item pool | Initial pool size | 3 to 4 times final length | DeVellis and Thorpe (2022) |
Content validity | I-CVI; S-CVI/Ave | 0.78 or above; 0.90 or above | Polit and Beck (2006) |
Pilot sample | Respondents | 10 per item; 200 to 300 total | Boateng et al. (2018) |
Item analysis | Corrected item-total r | 0.30 or above | Nunnally and Bernstein (1994) |
EFA | Primary loading | 0.40 or above | Hinkin (1998) |
CFA | CFI, TLI / RMSEA / SRMR | 0.95 / 0.06 / 0.08 | Hu and Bentler (1999) |
Reliability | Alpha or omega | 0.70 or above | Nunnally and Bernstein (1994); McNeish (2018) |
Stability | Test-retest ICC | 0.70 or above | Terwee et al. (2007) |
Floor and ceiling | Share at minimum or maximum | 15% or less | Terwee et al. (2007) |
Convergent validity | AVE | 0.50 or above | Fornell and Larcker (1981) |
Discriminant validity | HTMT | Below 0.85 | Henseler et al. (2015) |
Invariance | Change in CFI | 0.01 or less | Cheung and Rensvold (2002) |
These values are conventions, not laws, and should be applied with judgement about the construct and the purpose of the scale (Flake & Fried, 2020).
3. The PsychtrixWeb Scale Development Sandbox
PsychtrixWeb is a free, browser-based platform for psychometric analysis that requires no installation or coding and runs R-based procedures behind its interface (PsychTrix Innovative, n.d.). Alongside modules for path analysis, PLS-SEM, adaptive testing, network analysis and cultural adaptation, it offers a Scale Development Sandbox, described as "a comprehensive workspace for creating new psychological or educational scales from scratch" in which researchers "design items, test psychometric properties, and iterate until you have a robust instrument" (PsychTrix Innovative, 2026).
3.1 The sandbox dashboard
The landing page (Figure 2) lists each scale project as a card showing its number of items, number of responses and status (for example, draft). A summary panel lists the professional features: real-time data collection with shareable links, sharing through WhatsApp, email and social media, reliability analysis (alpha, omega and split-half), item analysis with discrimination indices, normative data and percentiles, and export to PDF, CSV and JSON.
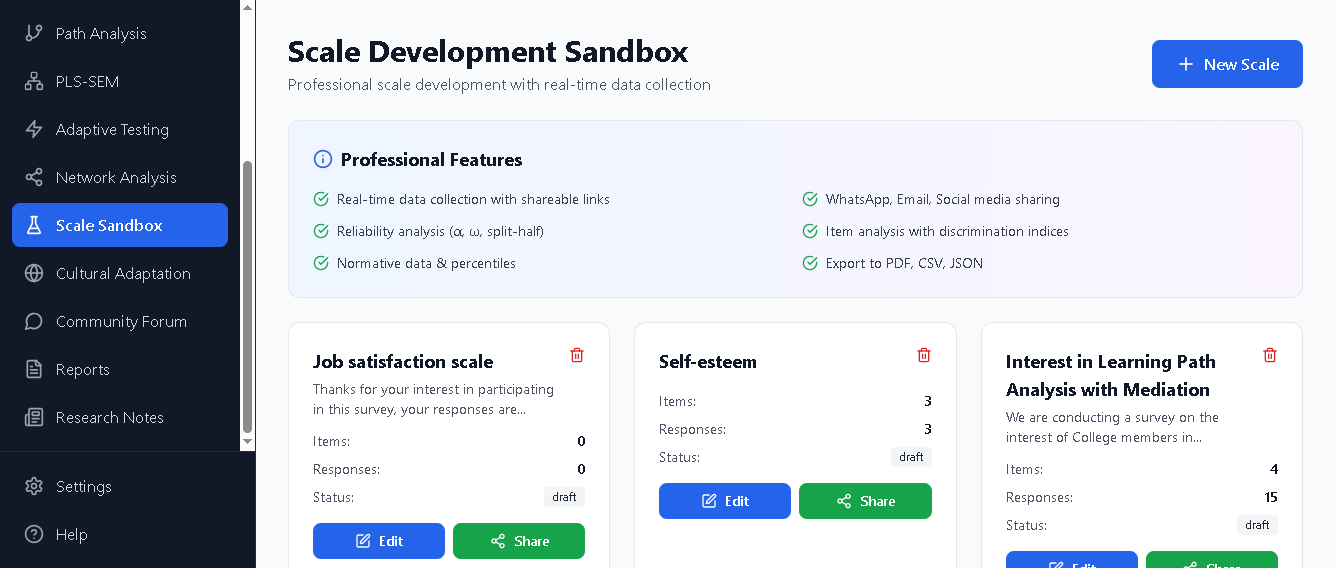
Figure 2. The Scale Development Sandbox dashboard, showing project cards and the feature summary.
3.2 Creating a scale project
A new project needs a name, a description and a response format (Figure 3). For a Likert scale the developer sets the minimum and maximum values, such as 1 to 5, so that every item in the instrument shares the same metric. The description doubles as the introduction respondents see, which is where the information and consent statement belongs.
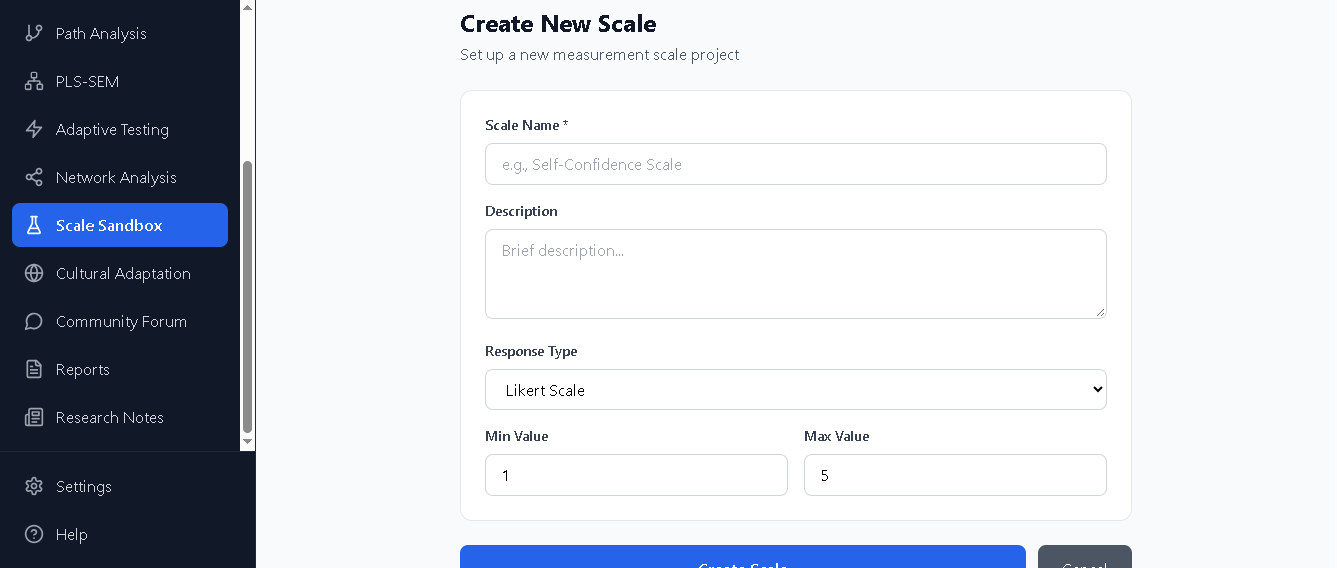
Figure 3. Creating a new scale project: name, description, response type and score range.
3.3 Building the construct hierarchy
The editing view (Figure 4) is the core of the sandbox. Items are not entered as a flat list of questions but within a hierarchy of construct, subconstruct or dimension, and item, and one questionnaire can hold several constructs. This structure mirrors the construct definition from Section 2.1 and is carried forward into every later analysis. The toolbar provides import of existing items, a respondent preview, a validation check that flags problems before data collection, and save. A suggestions panel proposes candidate item wordings that the developer may accept, edit or ignore. Items can be flagged as reverse-scored when they are added, and the sandbox recodes them automatically before any statistic is computed, removing a classic source of hand-coding error.
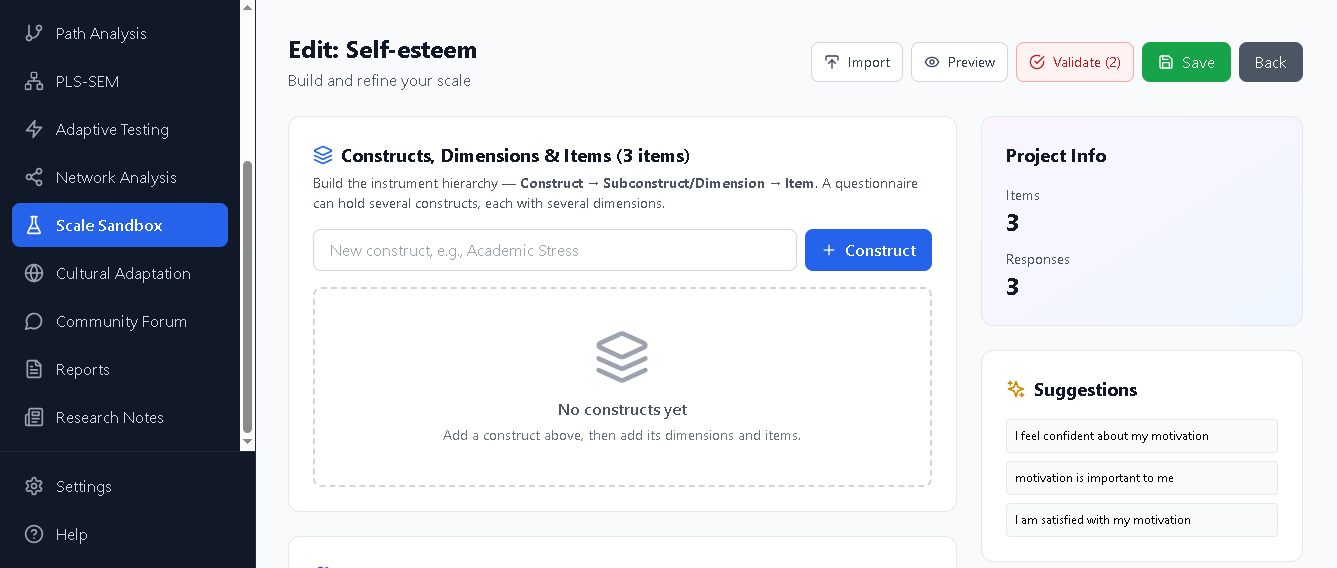
Figure 4. The editor, organised as construct, dimension and item, with project information and item suggestions.
3.4 Demographic, grouping variables and scoring rules
Demographic and grouping variables are defined separately from the scale items (Figure 5). Each can be categorical or another type, and can be given a role such as grouping for DIF and invariance. These variables become their own columns in the dataset, ready for group comparisons, multi-group CFA and DIF without any reshaping. Scoring rules state how many items a respondent must answer before a subscale, construct or total score is computed, and whether totals are prorated using the person's mean for missing items. Writing these rules down before data collection supports transparent reporting (Flake & Fried, 2020; Oladunmoye, Enamudu, & Sa'ad, 2024).
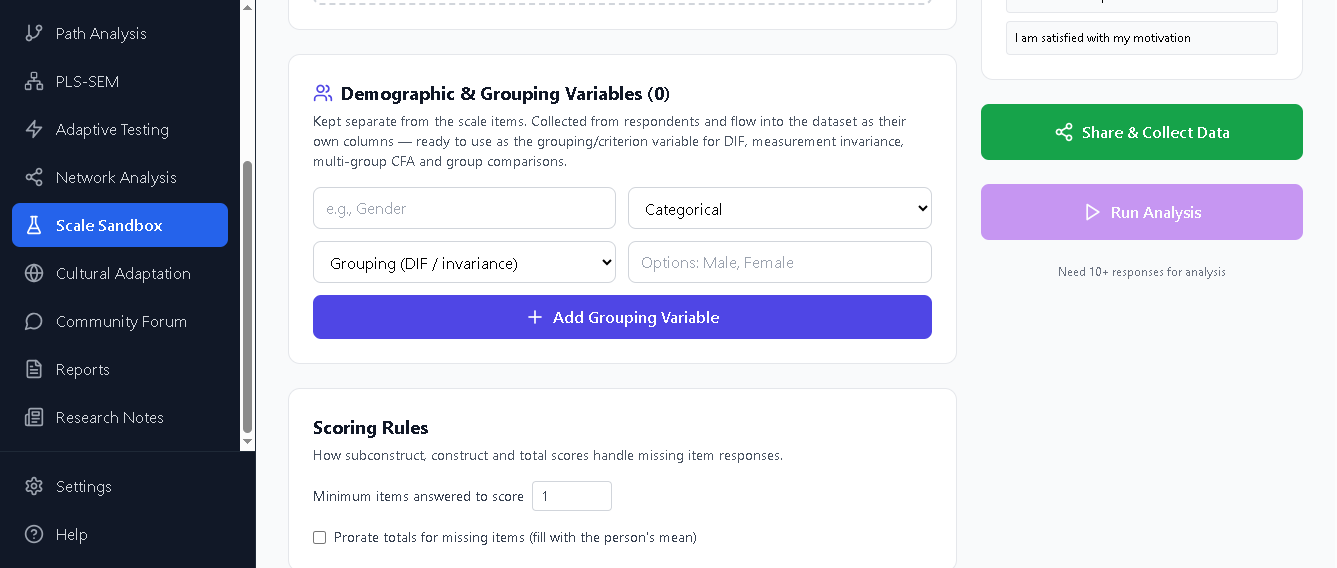
Figure 5. Grouping variables for DIF and invariance, and scoring rules for missing responses.
3.5 Collecting data through shareable links
Every scale receives its own public survey link (Figure 6). Respondents do not need a PsychtrixWeb account, the survey is mobile-friendly, and the link can be copied or sent directly through WhatsApp, email, Facebook or X (Twitter). Responses are stored anonymously, with no names or email addresses collected, and a live counter shows progress. Only the owner can view or analyse the raw responses. The sharing tips encourage at least 100 responses for a reliable analysis.
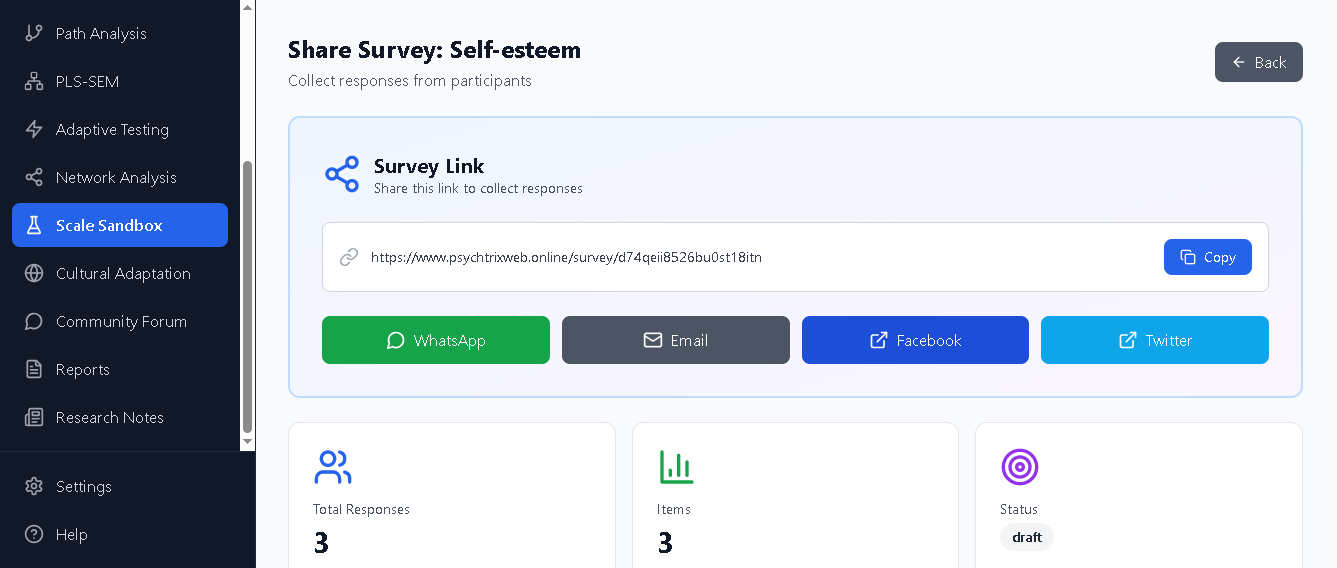
Figure 6. The sharing page: survey link, one-click sharing and live response counts.
3.6 Analysis outputs
Once at least 10 complete responses are in (100 or more recommended), the Run Analysis button computes, directly from the collected data:
- Cronbach's alpha with a bootstrap 95% confidence interval
- McDonald's omega from single-factor loadings, and split-half reliability
- Alpha for each subscale defined in the hierarchy
- Corrected item-total correlations and alpha-if-item-deleted for every item
- The standard error of measurement, and floor and ceiling effects flagged above 15% (Terwee et al., 2007)
- Percentile norms for interpreting individual scores
From the results, one click saves the responses as a dataset and opens CFA, measurement invariance, multi-group CFA or DIF with the dataset, grouping variable and factor structure (constructs and their items) already specified. The researcher therefore moves from Phase 2 to Phase 3 of Figure 1 without re-entering the model.
4. Developing a Scale in the Sandbox: A Step-by-Step Workflow
The sandbox's own guidance sets out five stages: define the construct, generate items, pilot test, analyse and refine, and validate (PsychTrix Innovative, 2026). The steps below expand these into a practical sequence and link each to the literature in Section 2. A worked example, an Academic Stress Scale for undergraduates with three dimensions (workload, examination anxiety and time pressure), is used for illustration.
- Write the construct specification outside the platform. Define academic stress, its three dimensions, and what it excludes (for example, general anxiety). Record the intended population and use of scores (Clark & Watson, 2019).
- Create the project. Select Scale Sandbox, then New Scale. Enter the name, a description that includes the purpose, anonymity statement and any consent wording your ethics committee requires, choose Likert Scale and set the range (for example, 1 to 5).
- Build the hierarchy. Add Academic Stress as a construct, then the three dimensions, then items under each. Aim for three to four times the final number of items, for instance 36 items for a planned 12-item scale.
- Flag reverse-keyed items as reversed when adding them; do not pre-recode.
- Use Import for items drafted elsewhere and treat the Suggestions panel as a prompt, not a substitute for theory.
- Establish content validity. Send the item list to six or more experts, compute I-CVI and CVR (Lawshe, 1975; Polit & Beck, 2006), and delete or rewrite weak items in the editor.
- Add grouping and demographic variables. Define, for example, Sex (categorical, grouping role, options Male and Female) and Level of study. These later serve as grouping variables for DIF and invariance.
- Set scoring rules. Decide the minimum number of items needed for a dimension score and whether to prorate. Report these decisions in the methods section.
- Validate and preview. Run Validate to clear warnings, then use Preview to view the survey as respondents will, ideally on a phone, and conduct a few cognitive interviews.
- Collect pilot data. Open Share & Collect Data, copy the link or send it by WhatsApp or email, and monitor the live counter. Target at least 10 respondents per item, here roughly 360.
- Run the item and reliability analysis. Use Run Analysis and inspect corrected item-total correlations (below 0.30), alpha-if-item-deleted, floor and ceiling effects, and alpha with its confidence interval alongside omega for each dimension.
- Refine the item set. Remove or revise weak items in the editor, guided by statistics and content coverage together, so that no dimension is left under-represented.
- Confirm structure and test invariance. Send the results to CFA on a new sample, then to measurement invariance, multi-group CFA or DIF using the grouping variable. Check fit against Hu and Bentler (1999) and invariance against Cheung and Rensvold (2002).
- Interpret and report. Use percentile norms and the SEM to interpret individual scores, export results as PDF, CSV or JSON, and write up every decision for transparency (Flake & Fried, 2020).
5. Comparison with Google Forms, Microsoft Forms and KoboToolbox
Google Forms, Microsoft Forms and KoboToolbox are excellent data collection tools, and KoboToolbox in particular leads on offline and field collection. None of them, however, models items as indicators of constructs or computes any psychometric statistic. Table 2 compares the four tools on features relevant to scale development, based on vendor documentation consulted on Oct 19, 2026 (Google, n.d.; Kobo Inc., n.d.-a, n.d.-b; Microsoft, n.d.; PsychTrix Innovative, 2026).
Table 2. Feature comparison for scale development
Feature | PsychtrixWeb Sandbox | Google Forms | Microsoft Forms | KoboToolbox |
|---|---|---|---|---|
Data collection | ||||
Shareable web survey link | Yes | Yes | Yes | Yes |
No respondent account needed | Yes | Yes | Yes | Yes |
Mobile-friendly form | Yes | Yes | Yes | Yes |
Likert or rating item format | Yes | Yes (linear scale, grid) | Yes (Likert) | Yes |
Branching and skip logic | Not shown | Yes | Yes | Yes |
Offline collection | No | No | No | Yes (KoboCollect) |
Built-in WhatsApp sharing | Yes | No | No | No |
Automatic response summaries | Not shown | Yes | Yes | Yes |
Psychometric workflow | ||||
Construct, dimension, item hierarchy | Yes | Partial (sections only) | Partial (sections only) | Partial (groups only) |
Reverse-score flag with auto recoding | Yes | No | No | Partial (manual calculations) |
Grouping variables with analytic role | Yes | No | No | No |
Scoring rules for missing items | Yes | No | No | Partial (manual calculations) |
Alpha with bootstrap 95% CI | Yes | No | No | No |
Omega and split-half reliability | Yes | No | No | No |
Item-total r and alpha-if-deleted | Yes | No | No | No |
SEM, floor and ceiling effects | Yes | No | No | No |
Percentile norms | Yes | No | No | No |
Direct hand-off to CFA, invariance, DIF | Yes | No | No | No |
Export and cost | ||||
Export formats | PDF, CSV, JSON | Google Sheets, CSV | Excel | XLS, CSV, SPSS labels, GeoJSON |
Cost and response limits | Free | Free with Google account | Free personal: 200 responses per form; work or school: up to 5,000,000 | Free community plan |
Note. "Not shown" means the feature does not appear in the screenshots and documentation reviewed; it may exist. Partial means the tool can approximate the feature only through manual configuration with no measurement meaning attached.
Figure 7 scores the same rows. The general tools reach 75% to 88% of the data collection features but between 5% and 15% of the psychometric ones, while the sandbox covers all psychometric features and trails on collection extras such as offline mode.
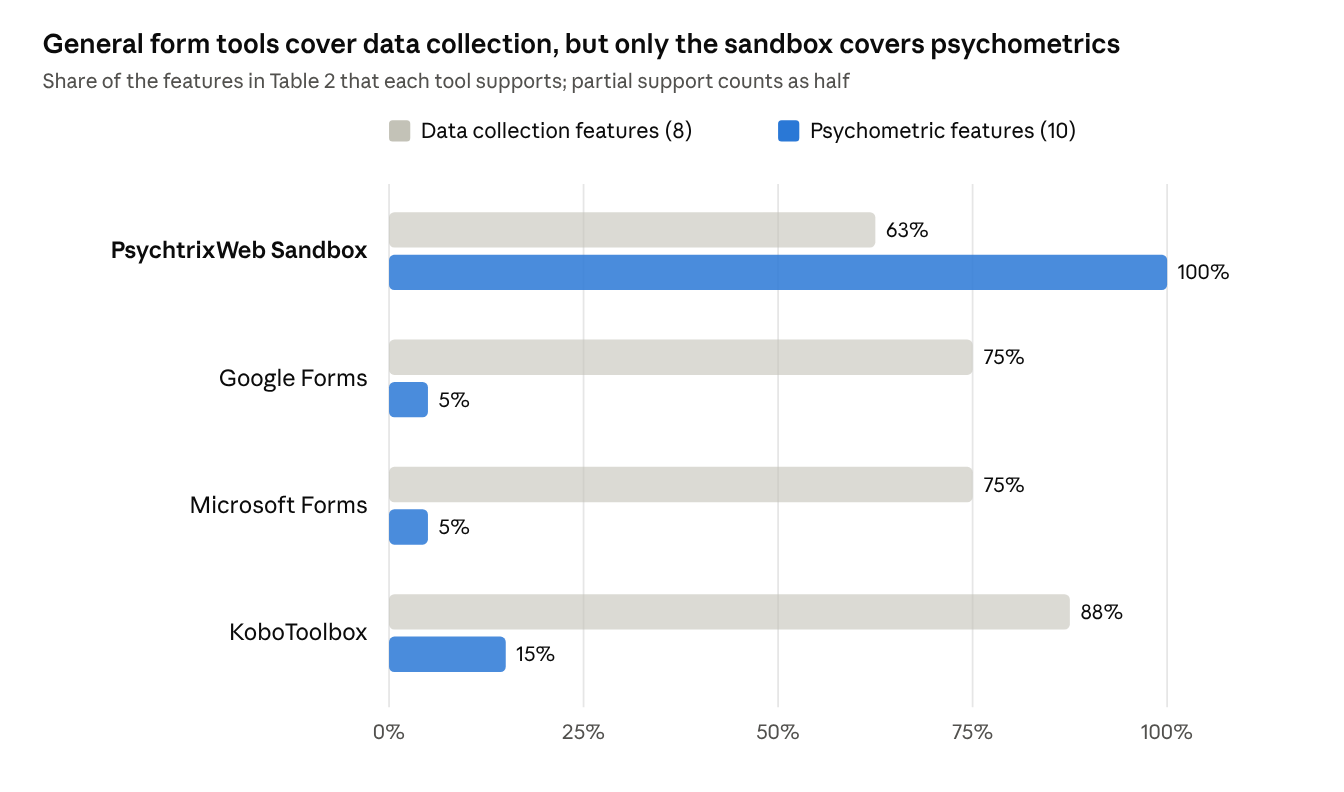
Figure 7. Feature coverage scored from Table 2 (Yes = 1, Partial = 0.5)
The practical consequence is the length of the pipeline. With a general form tool, the researcher exports a spreadsheet, recodes reversed items, rebuilds subscale membership, imports the data into a statistics package and specifies the factor model again. In the sandbox those steps are absorbed into the instrument definition, as Figure 8 shows.
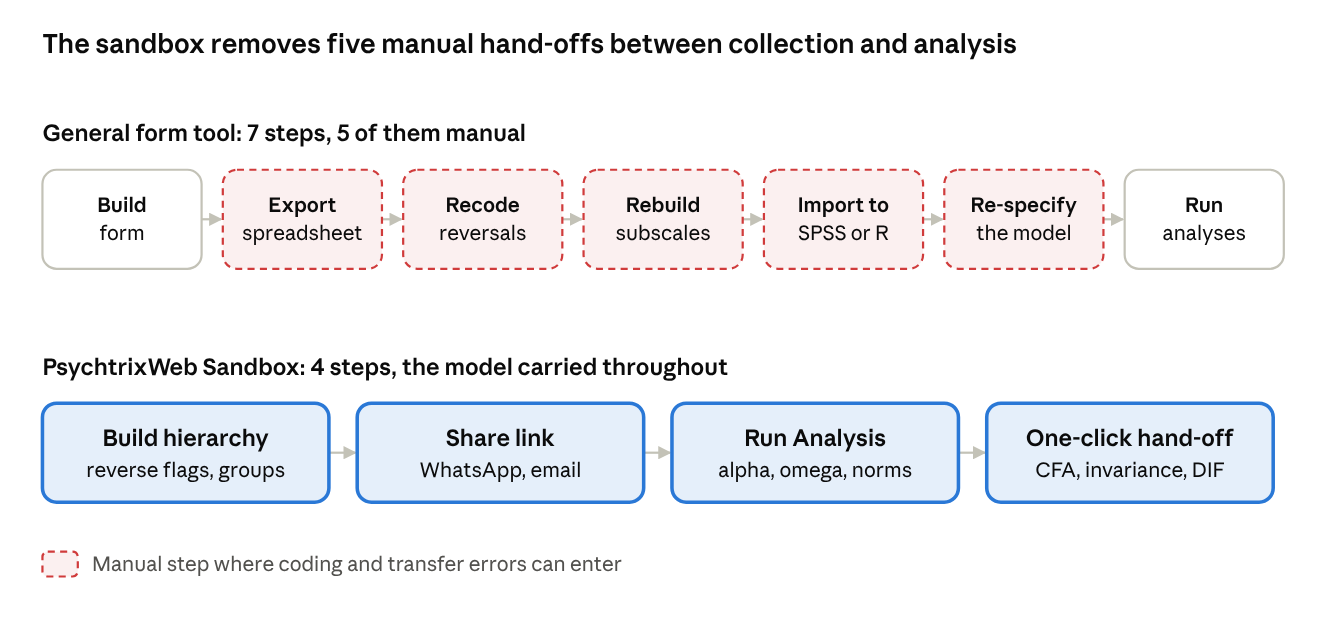
Figure 8. Analysis pipeline with a general form tool compared with the sandbox
Each dashed step in the upper row is a point where a reversed item can be left unrecoded, an item assigned to the wrong subscale, or a grouping variable mislabelled; the sandbox records these decisions once, in the instrument itself.
6. Justification and Benefits
The case for using the sandbox rests not on better forms but on better measurement. Six benefits follow from the comparison above.
6.1 The measurement model is built in from the start. Because items are entered under constructs and dimensions, the theoretical structure from Section 2.1 is recorded before any data exist. This discourages the post hoc grouping of items to fit the data, which Flake and Fried (2020) identify as a common questionable measurement practice, and it makes subscale reliability and CFA possible without re-specification.
6.2 Fewer avoidable errors. Reverse-keyed items are among the most frequent sources of error in scale analysis: a single unrecoded item depresses alpha and distorts loadings. Automatic recoding, predeclared grouping variables and stored scoring rules remove the five manual steps shown in Figure 8.
6.3 Reporting that meets current standards. The default output goes beyond a single alpha. Confidence intervals for alpha, omega, the SEM and floor and ceiling effects are what reviewers increasingly expect (McNeish, 2018; Terwee et al., 2007; AERA et al., 2014). Researchers who would not have computed these in a general tool receive them by default.
6.4 A shorter development cycle. Scale development is iterative (Figure 1). When revising an item, re-sharing the link and re-running the analysis take minutes rather than a round of exporting and re-importing, so developers are more likely to complete the several pilot rounds that good practice requires.
6.5 Access in low-resource settings. Commercial statistical packages carry licence costs that many students and institutions, particularly in sub-Saharan Africa, cannot meet. PsychtrixWeb is free, runs in a browser and needs no coding (PsychTrix Innovative, n.d.). WhatsApp sharing matches how many respondents in the region are most easily reached, and the mobile-friendly survey suits populations who access the internet mainly by phone.
6.6 Built-in ethics and data protection. Responses are anonymous by default, no names or emails are collected, and only the owner can view raw data. This supports compliance with data protection law such as the EU General Data Protection Regulation (Regulation (EU) 2016/679, 2016) and the Nigeria Data Protection Act 2023, although researchers remain responsible for their own consent procedures and approvals.
Table 3. When to choose each tool
Situation | Recommended tool |
|---|---|
Developing or refining a multi-item psychological or educational scale | PsychtrixWeb Sandbox |
Adapting an existing scale to a new language or culture | PsychtrixWeb Sandbox with its Cultural Adaptation module |
Field surveys without internet, household or humanitarian data | KoboToolbox |
Quick institutional feedback, registrations or quizzes | Google Forms or Microsoft Forms |
Complex branching questionnaires with no psychometric analysis | Google Forms, Microsoft Forms or KoboToolbox |
7. Limitations and Recommendations
The sandbox is a tool, and good tools do not replace good judgement. Several limitations should be acknowledged.
- Statistics are not validity. High alpha shows internal consistency, not that the scale measures the intended construct. Content review, cognitive interviews and external criterion evidence remain the researcher's responsibility (Messick, 1995).
- Collection features are narrower. The screenshots and documentation reviewed show no offline mode, and branching logic was not observed. For field studies without connectivity, KoboToolbox remains the better collection tool, and its exported data can be analysed separately.
- Small samples are allowed but risky. Analysis is enabled from 10 responses for convenience, but estimates from small samples are unstable; the platform's own advice of 100 or more, and the literature's 200 to 300 for factor analysis, should be followed (Boateng et al., 2018).
- Automated suggestions need scrutiny. Suggested item wordings should be checked against the construct definition; in Figure 4, for example, the suggestions concern motivation within a self-esteem project.
- Convenience sampling through social media. Links shared on WhatsApp or Facebook produce self-selected samples, which limits the representativeness of norms. Percentile norms should be labelled with the sample on which they are based.
- Platform dependence. As with any hosted service, researchers should export raw data and results regularly and keep their own archive for reproducibility.
It is therefore recommended that researchers (a) write and preregister the construct definition and scoring rules before collection, (b) use separate samples for exploratory and confirmatory analyses, (c) report omega and confidence intervals as well as alpha, (d) test measurement invariance before comparing groups, and (e) describe every item retention decision in the published report.
8. Conclusion
Sound scales are built through a deliberate sequence of construct definition, item generation, expert review, piloting, item analysis, factor analysis and evaluation of reliability, validity and invariance. General tools such as Google Forms, Microsoft Forms and KoboToolbox collect data efficiently but leave every one of these psychometric steps to other software and to manual work. The PsychtrixWeb Scale Development Sandbox keeps the measurement model, data collection and analysis in one free, browser-based environment, and it reports by default the indices that current standards expect. For students and researchers, particularly in low-resource settings, it lowers both the cost and the error rate of doing measurement properly. Used alongside careful theory and transparent reporting, it can help close the gap between how scales should be developed and how they often are.
References
- American Educational Research Association, American Psychological Association, & National Council on Measurement in Education. (2014). Standards for educational and psychological testing. American Educational Research Association.
- Beaton, D. E., Bombardier, C., Guillemin, F., & Ferraz, M. B. (2000). Guidelines for the process of cross-cultural adaptation of self-report measures. Spine, 25(24), 3186-3191. https://doi.org/10.1097/00007632-200012150-00014
- Boateng, G. O., Neilands, T. B., Frongillo, E. A., Melgar-Quiñonez, H. R., & Young, S. L. (2018). Best practices for developing and validating scales for health, social, and behavioral research: A primer. Frontiers in Public Health, 6, Article 149. https://doi.org/10.3389/fpubh.2018.00149
- Campbell, D. T., & Fiske, D. W. (1959). Convergent and discriminant validation by the multitrait-multimethod matrix. Psychological Bulletin, 56(2), 81-105. https://doi.org/10.1037/h0046016
- Cheung, G. W., & Rensvold, R. B. (2002). Evaluating goodness-of-fit indexes for testing measurement invariance. Structural Equation Modeling, 9(2), 233-255. https://doi.org/10.1207/S15328007SEM0902_5
- Clark, L. A., & Watson, D. (1995). Constructing validity: Basic issues in objective scale development. Psychological Assessment, 7(3), 309-319. https://doi.org/10.1037/1040-3590.7.3.309
- Clark, L. A., & Watson, D. (2019). Constructing validity: New developments in creating objective measuring instruments. Psychological Assessment, 31(12), 1412-1427. https://doi.org/10.1037/pas0000626
- Costello, A. B., & Osborne, J. (2005). Best practices in exploratory factor analysis: Four recommendations for getting the most from your analysis. Practical Assessment, Research, and Evaluation, 10, Article 7. https://doi.org/10.7275/jyj1-4868
- Cronbach, L. J. (1951). Coefficient alpha and the internal structure of tests. Psychometrika, 16(3), 297-334. https://doi.org/10.1007/BF02310555
- DeVellis, R. F., & Thorpe, C. T. (2022). Scale development: Theory and applications (5th ed.). SAGE.
- Flake, J. K., & Fried, E. I. (2020). Measurement schmeasurement: Questionable measurement practices and how to avoid them. Advances in Methods and Practices in Psychological Science, 3(4), 456-465. https://doi.org/10.1177/2515245920952393
- Flake, J. K., Pek, J., & Hehman, E. (2017). Construct validation in social and personality research: Current practice and recommendations. Social Psychological and Personality Science, 8(4), 370-378. https://doi.org/10.1177/1948550617693063
- Fornell, C., & Larcker, D. F. (1981). Evaluating structural equation models with unobservable variables and measurement error. Journal of Marketing Research, 18(1), 39-50. https://doi.org/10.1177/002224378101800104
- Google. (n.d.). Choose a type of question for your form. Google Docs Editors Help. Retrieved October 19, 2026, from https://support.google.com/docs/answer/7322334
- Henseler, J., Ringle, C. M., & Sarstedt, M. (2015). A new criterion for assessing discriminant validity in variance-based structural equation modeling. Journal of the Academy of Marketing Science, 43(1), 115-135. https://doi.org/10.1007/s11747-014-0403-8
- Hinkin, T. R. (1998). A brief tutorial on the development of measures for use in survey questionnaires. Organizational Research Methods, 1(1), 104-121. https://doi.org/10.1177/109442819800100106
- Holland, P. W., & Wainer, H. (Eds.). (1993). Differential item functioning. Lawrence Erlbaum Associates.
- Horn, J. L. (1965). A rationale and test for the number of factors in factor analysis. Psychometrika, 30(2), 179-185. https://doi.org/10.1007/BF02289447
- Hu, L., & Bentler, P. M. (1999). Cutoff criteria for fit indexes in covariance structure analysis: Conventional criteria versus new alternatives. Structural Equation Modeling, 6(1), 1-55. https://doi.org/10.1080/10705519909540118
- Kobo Inc. (n.d.-a). Exporting and downloading your data. KoboToolbox Help Center. Retrieved October 19, 2026, from https://support.kobotoolbox.org/export_download.html
- Kobo Inc. (n.d.-b). What is KoboToolbox? KoboToolbox Help Center. Retrieved October 19, 2026, from https://support.kobotoolbox.org/welcome.html
- Lawshe, C. H. (1975). A quantitative approach to content validity. Personnel Psychology, 28(4), 563-575. https://doi.org/10.1111/j.1744-6570.1975.tb01393.x
- McDonald, R. P. (1999). Test theory: A unified treatment. Lawrence Erlbaum Associates.
- McNeish, D. (2018). Thanks coefficient alpha, we'll take it from here. Psychological Methods, 23(3), 412-433. https://doi.org/10.1037/met0000144
- Messick, S. (1995). Validity of psychological assessment: Validation of inferences from persons' responses and performances as scientific inquiry into score meaning. American Psychologist, 50(9), 741-749. https://doi.org/10.1037/0003-066X.50.9.741
- Microsoft. (n.d.). Form, question, response, and character limits in Microsoft Forms. Microsoft Support. Retrieved October 19, 2026, from https://support.microsoft.com/en-gb/office/ec15323d-92a4-4c33-bf88-3fdb9e5b5fea
- Nigeria Data Protection Act 2023. (2023). Federal Republic of Nigeria.
- Nunnally, J. C., & Bernstein, I. H. (1994). Psychometric theory (3rd ed.). McGraw-Hill.
- Oladunmoye E.O (2025). Ultra-short scales in employee assessment: balancing efficiency and accuracy. Journal of Applied Sciences, Information and Computing.6(2),103-108.
- Oladunmoye, E. O. (2026a). How Many Factors Does a Psychological Scale Really Have?. PsychtrixWeb Research Note, 009. Psychtrix Initiative Limited. https://doi.org/10.5281/zenodo.23064653
- Oladunmoye, E. O. (2026b). From Questionnaire to Validated Instrument: A Complete Psychometric Analysis Workflow Using PsychtrixWeb. PsychtrixWeb Research Note, 006. Psychtrix Initiative Limited. https://doi.org/10.5281/zenodo.23064639
- Oladunmoye, E. O. (2026c). Validity in Psychological Assessment: Evidence, Interpretation, and Common Misconceptions. PsychtrixWeb Research Note, 005. Psychtrix Initiative Limited. https://doi.org/10.5281/zenodo.23087862
- Oladunmoye, E. O. (2026d). Reliability in Psychological Measurement. PsychtrixWeb Research Note, 004. Psychtrix Initiative Limited. https://doi.org/10.5281/zenodo.23064620
- Oladunmoye, E. O. (2026e). Understanding Psychometric Measurement. PsychtrixWeb Research Note, 003. Psychtrix Initiative Limited. https://doi.org/10.5281/zenodo.22653162
- Oladunmoye, E. O. (2026f). Cronbach's Alpha versus McDonald's Omega. PsychtrixWeb Research Note, 008. Psychtrix Initiative Limited. https://doi.org/10.5281/zenodo.23063629
- Oladunmoye, E. O., (2015). Development and validation of social provision scale on first year undergraduate psychological adjustment. Journal of Education and Practice, 6 (28), 78-90.
- Oladunmoye, E. O., Muhammad T. S., (2024). Development and Validation of Multiple Intelligence Test among emerging adults in the United Kingdom. ISAR Journal of Arts, Humanities and Social Sciences, 2(4), 18-24.
- Oladunmoye, E.O., Enamudu, G.P., Sa'ad, M.T. (2024). A Differential Item Functioning estimate of WAEC Mathematics test form based on gender and age among secondary school students. ISAR Journal of Multidisciplinary Research and Studies, 2(5), 15-21.
- Polit, D. F., & Beck, C. T. (2006). The content validity index: Are you sure you know what's being reported? Critique and recommendations. Research in Nursing & Health, 29(5), 489-497. https://doi.org/10.1002/nur.20147
- PsychTrix Innovative. (2026). Scale Development Sandbox [Web application module]. PsychtrixWeb. Retrieved October 19, 2026, from https://www.psychtrixweb.online
- PsychTrix Innovative. (n.d.). PsychTrix: Free psychometric analysis platform. Retrieved October 19, 2026, from https://www.psychtrixweb.online
- Putnick, D. L., & Bornstein, M. H. (2016). Measurement invariance conventions and reporting: The state of the art and future directions for psychological research. Developmental Review, 41, 71-90. https://doi.org/10.1016/j.dr.2016.06.004
- Regulation (EU) 2016/679 of the European Parliament and of the Council of 27 April 2016 on the protection of natural persons with regard to the processing of personal data and on the free movement of such data (General Data Protection Regulation). (2016). Official Journal of the European Union, L 119, 1-88. http://data.europa.eu/eli/reg/2016/679/oj
- Terwee, C. B., Bot, S. D. M., de Boer, M. R., van der Windt, D. A. W. M., Knol, D. L., Dekker, J., Bouter, L. M., & de Vet, H. C. W. (2007). Quality criteria were proposed for measurement properties of health status questionnaires. Journal of Clinical Epidemiology, 60(1), 34-42. https://doi.org/10.1016/j.jclinepi.2006.03.012
- Worthington, R. L., & Whittaker, T. A. (2006). Scale development research: A content analysis and recommendations for best practices. The Counseling Psychologist, 34(6), 806-838. https://doi.org/10.1177/0011000006288127
Suggested citation
Oladunmoye, E. O. (2026). Psychometric Scale Development with the PsychtrixWeb Scale Sandbox. PsychtrixWeb Research Note, 020. Psychtrix Initiative Limited. https://doi.org/10.5281/zenodo.23482609Discuss this Research Note
Scholarly comments are welcome from anyone — no account required. Contributions are moderated before they appear.
No comments yet. Start the scholarly discussion below.