
Measurement Invariance Across Groups: Connecting Confirmatory Factor Analytic and Item Response Theory Perspectives
Abstract
Comparisons of psychological scores across groups, cultures, languages or occasions are interpretable only if the instrument measures the same construct in the same way in each. This note reviews measurement invariance as formulated in the confirmatory factor analytic (CFA) tradition and differential item functioning (DIF) as formulated in the item response theory (IRT) tradition, and sets out how the two can be combined in one staged workflow. It defines configural, metric, scalar (threshold) and strict invariance, explains why the level required depends on the intended comparison, and summarises current guidance on fit criteria, ordinal indicators, partial invariance, approximate invariance, alignment and Bayesian methods. It then describes the mathematical correspondence between ordinal CFA and the graded response model, and argues that the two traditions share a common model family and differ mainly in parameterisation, testing strategy and emphasis. Illustrative computations based on hypothetical item parameters show how uniform and non-uniform DIF alter item response functions, and how group-specific test information and conditional standard errors can reveal differences in precision that invariance tests alone do not. A seven-stage workflow, a table of common pitfalls and a reporting checklist are proposed. The workflow is a synthesis and has not been validated empirically; priorities for simulation and applied research are identified.
1. Introduction
Psychological research routinely compares groups: men and women, adolescents and adults, clinical and non-clinical samples, speakers of different languages, residents of different countries, or the same respondents before and after an intervention. Every such comparison carries an assumption that the instrument measures the construct equivalently in each group. If it does not, an observed difference may reflect how the scale operates rather than how much of the construct respondents possess.
Measurement invariance is the property that justifies this assumption. Formally, it holds when the distribution of observed responses given the latent variable does not depend on group membership, that is, f(X | η, G) = f(X | η) (Mellenbergh, 1989; Meredith, 1993; Millsap, 2011). Two methodological traditions have developed procedures for examining it. The first, rooted in multigroup factor analysis (Jöreskog, 1971; Sörbom, 1974), tests whether loadings, intercepts or thresholds and residual variances can be constrained equal across groups. The second, rooted in item response theory, asks whether item response functions differ across groups at the same level of the latent trait, a property usually labelled differential item functioning (Holland & Wainer, 1993; Mellenbergh, 1989; Oyedele, Oladunmoye, Obi & Nakalema, 2025).
The two literatures have grown partly in parallel. Early comparisons argued that they offer complementary evidence (Reise et al., 1993), and later work examined how far their conclusions agree and how they might be combined (Meade & Lautenschlager, 2004; Raju et al., 2002; Stark et al., 2006). In applied work, researchers often run one procedure, sometimes both, and are then unsure how to reconcile a significant drop in model fit with a handful of flagged items. This note addresses that gap.
The note has three aims. The first is to summarise the CFA hierarchy of invariance and current guidance for evaluating it, including the treatment of ordinal indicators and the use of partial and approximate invariance. The second is to set out precisely how CFA and IRT parameters relate, and where the correspondence breaks down. The third is to propose a workflow that extends conventional invariance testing to group-specific measurement precision and targeting, together with practical reporting recommendations. The note is conceptual and integrative. It does not report an empirical study, and its figures use hypothetical parameters for illustration.
2. Approach and Scope
The note is a narrative methodological synthesis. Sources were selected for their foundational status in the invariance and DIF literatures, for their role in shaping current reporting guidance, or for direct evidence from simulation studies and reviews of practice. The selection was purposive and is not a systematic review, so no claim is made that the literature is covered exhaustively. Where a source is cited for a specific numerical criterion, the conditions under which it was derived are stated, because several widely used cut-offs were obtained under restricted simulation conditions.
The illustrative computations in Section 6 and Section 7 use a hypothetical six-item scale with five ordered response categories, calibrated with the graded response model (Samejima, 1969). Parameters are listed in Appendix A. Group A is the reference group and Group B the focal group. Item 2 carries a uniform DIF effect (all four thresholds shifted by 0.70 logits) and Item 3 a non-uniform DIF effect (discrimination reduced from 1.30 to 0.70). Latent traits are distributed N(0, 1) in Group A and N(−0.4, 1) in Group B. All quantities were computed analytically in Python (NumPy, Matplotlib). No empirical data were analysed, and the values should be read as demonstrations, not estimates.
3. Conceptual Foundations
3.1 Why invariance matters for score comparison
Consider a one-factor model for item i in group g:
Xig = τig + λig ηg + εig (1)
where τ is the item intercept, λ the factor loading, η the latent variable with mean κg in group g, and ε a residual with variance θig. The expected item score in group g is τig + λig κg, so the observed difference between two groups is
E(XiA) − E(XiB) = (τiA − τiB) + λiA κA − λiB κB (2)
If loadings and intercepts are equal across groups, the right-hand side reduces to λi(κA − κB) and the observed difference reflects only the latent mean difference. If they are not, differences in intercepts and loadings enter the observed difference and cannot be separated from the construct difference without further modelling. This is the practical reason for testing invariance before interpreting group differences (Borsboom, 2006; Millsap, 2011; Vandenberg & Lance, 2000; Oladunmoye, Agbor, Olabisi, & Oyadeyi, 2024).
3.2 Historical development
Jöreskog (1971) introduced simultaneous factor analysis in several populations, and Sörbom (1974) extended it to group differences in latent means. Meredith (1993) provided the formal definitions of weak, strong and strict factorial invariance and linked them to measurement bias and selection. The labels configural and metric invariance were popularised by Horn and McArdle (1992), and Vandenberg and Lance (2000) consolidated the sequential testing strategy that dominates applied work. Widaman and Reise (1997) discussed the hierarchy from a substantive viewpoint, and Putnick and Bornstein (2016) documented how the framework is used and reported in psychological research.
3.3 The four conventional levels
Table 1 summarises the hierarchy. Each level adds equality constraints to the previous one. Configural invariance requires the same pattern of fixed and free parameters, that is, the same items defining the same factors, without requiring equal values. Metric invariance adds equal loadings, which supports comparisons of factor variances, covariances and structural relations. Scalar invariance adds equal intercepts (thresholds for ordinal indicators) and supports latent mean comparison. Strict invariance adds equal residual variances (Oladunmoye, Enamudu, & Sa'ad, 2024).
Table 1. The conventional hierarchy of factorial invariance
Level | Added constraint | Question addressed | Comparisons supported |
|---|---|---|---|
Configural | Same pattern of free and fixed parameters | Do the same items define the same factors? | Qualitative equivalence of structure; no numerical comparison |
Metric (weak) | λiA = λiB | Do items relate to the construct with equal strength? | Factor variances, covariances, regression paths |
Scalar (strong) | τiA = τiB (thresholds for ordinal items) | Do groups share the same item origins? | Latent means; interpretable item-level mean differences |
Strict | θiA = θiB | Is unique variance equal? | Observed-score variances, reliabilities, composite comparisons |
Strict invariance is not a prerequisite for latent mean comparison (Putnick & Bornstein, 2016; Widaman & Reise, 1997). It becomes relevant when observed-score variances, reliabilities or prediction of observed scores are to be compared (Meredith, 1993; Millsap, 2007). The level required therefore depends on the research question, the type of comparison and the consequences of the interpretation, and testing every level mechanically is not good practice. Invariance is also better regarded as a matter of degree, supported for particular items, parameters, groups and purposes, than as a single yes or no property of a scale.
4. Evaluating Invariance in the CFA Framework
4.1 Nested model comparison and fit criteria
Invariance is usually evaluated by comparing nested models. The chi-square difference test is sensitive to sample size and can flag trivial differences in large samples, which led Cheung and Rensvold (2002) to propose changes in approximate fit indices, with a decrease in CFI of more than .01 suggesting non-invariance. Chen (2007) examined CFI, RMSEA and SRMR and proposed combined rules, for example a CFI decrease of .010 supplemented by an RMSEA increase of .015 or an SRMR increase of .030 for loadings and .015 for intercepts, for samples that were equal in size and larger than 300 per group. Meade et al. (2008) found that approximate indices are less sensitive to sample size than chi-square and more sensitive to non-invariance, and argued for criteria that depend on the study conditions.
These thresholds were derived under specific simulation conditions, typically continuous indicators, maximum likelihood estimation and two groups, and they do not transfer automatically to ordinal estimators, unequal group sizes or many groups. Rutkowski and Svetina (2014) showed that, with many groups, more lenient criteria for metric invariance can be appropriate. The cut-offs are best treated as heuristics, supplemented by inspection of the parameters that change and by effect-size measures of the practical impact of non-invariance on scores (Millsap & Olivera-Aguilar, 2012; Nye & Drasgow, 2011; Oladunmoye & Muhammad, 2024; Oladunmoye, 2015), and by a check on whether substantive conclusions change when constraints are released.
4.2 Ordinal indicators
Likert-type items are ordinal. Treating them as continuous can be acceptable for some purposes when there are five or more categories and distributions are not strongly skewed (Rhemtulla et al., 2012), but it can distort multigroup comparisons because intercepts and loadings of continuous models are not well defined for discrete responses (Lubke & Muthén, 2004). The recommended alternative is a categorical estimator, such as robust diagonally weighted least squares (Li, 2016; Muthén, 1984), with an invariance sequence that targets thresholds (Millsap & Yun-Tein, 2004). Two cautions apply. First, the identification of ordinal multigroup models depends on scaling constraints, so the continuous-data sequence cannot be transferred mechanically; for binary items loadings and thresholds must be constrained together, and for polytomous items the order of constraints matters (Millsap & Yun-Tein, 2004; Wu & Estabrook, 2016). Second, the power of invariance tests with dichotomous indicators and weighted least squares estimation can be low (French & Finch, 2006), which argues for adequate group sizes and for reporting the information available to detect differences.
5. Partial and Approximate Invariance
When full invariance fails, partial invariance allows the offending parameters to be freely estimated while the rest remain constrained (Byrne et al., 1989). The justification is that latent means and variances remain identified and interpretable as long as enough invariant indicators anchor the metric. Steenkamp and Baumgartner (1998) suggested that at least two indicators per factor, in addition to the scaling indicator, should retain invariant loadings and intercepts. Millsap and Kwok (2004) showed that the consequences of partial invariance for selection decisions depend on the pattern and size of the non-invariance, so that the question is not only whether a model fits but also what the remaining differences do to the intended use of the scores.
The main danger is capitalisation on chance. Model modifications guided purely by modification indices tend to produce sample-specific solutions (MacCallum et al., 1992), and data-driven specification searches for non-invariant parameters can fail to recover the true pattern (Yoon & Millsap, 2007). A modification index is not a theoretical justification. Freed parameters should be supported by item content, translation review or prior evidence, reported in full, and evaluated for their effect on conclusions, ideally in a second sample.
Exact equality is sometimes too strict for large numbers of groups, such as countries or language communities. Bayesian approximate invariance replaces exact equality with small-variance priors on parameter differences (Muthén & Asparouhov, 2012; van de Schoot et al., 2013; Cieciuch et al., 2014). The alignment method estimates group-specific factor means and variances so that non-invariance is minimised and concentrated in a few parameters (Asparouhov & Muthén, 2014; Muthén & Asparouhov, 2018), and extensions address situations in which scalar invariance fails (Marsh et al., 2018). These methods are tools for estimating latent means under approximate invariance, not evidence that invariance holds. They work best when only a modest proportion of parameters is non-invariant, and simulation checks on the alignment solution are advisable (Muthén & Asparouhov, 2018).
6. The IRT Perspective and Its Relation to CFA
6.1 Item response functions and DIF
In IRT, invariance means that the probability of each response category is the same for respondents with the same latent trait, whatever their group: P(Xi = k | θ, G) = P(Xi = k | θ). For ordered responses, the graded response model gives cumulative category probabilities (Samejima, 1969):
P∗ik(θ) = 1 / (1 + exp[−ai(θ − bik)]) (3)
where ai is the discrimination and bik the location of the kth threshold, with Pik = P∗ik − P∗i,k+1. Group differences in the b parameters correspond to uniform DIF, and differences in a to non-uniform DIF (Mellenbergh, 1989). Figure 1 illustrates both for the hypothetical items in Appendix A.
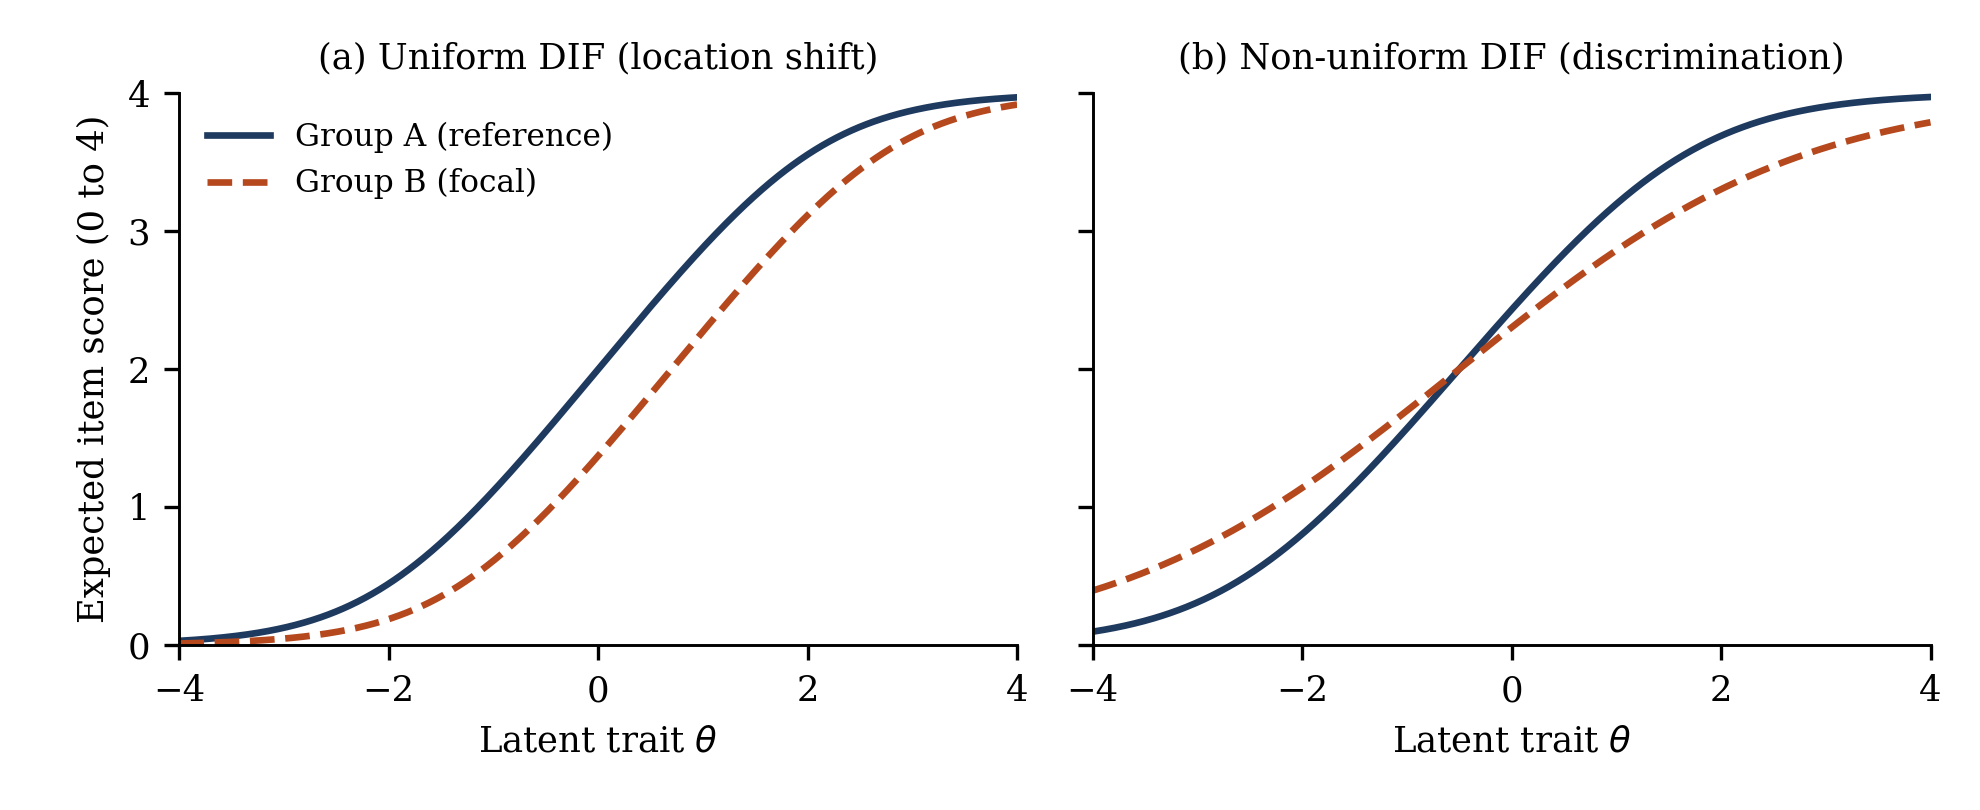
Figure 1. Expected item score as a function of the latent trait for a reference group (A) and a focal group (B). (a) Uniform DIF: all thresholds of Item 2 are shifted by 0.70 in Group B, so respondents of equal trait level obtain lower expected scores. (b) Non-uniform DIF: discrimination of Item 3 falls from 1.30 to 0.70 in Group B, so the curves cross and the group difference depends on trait level. Hypothetical parameters.
Procedures for detecting DIF include IRT likelihood-ratio tests of constrained and free parameters (Thissen et al., 1993), logistic regression (Swaminathan & Rogers, 1990) and moderated nonlinear factor analysis, which accommodates continuous covariates and several grouping variables at once (Bauer, 2017). Zumbo (2007) reviews the development of these methods. Results depend on the choice of anchor items, for which empirical selection procedures exist (Woods, 2009), and a statistically significant item should be accompanied by an effect size at item and test level (Chalmers et al., 2016; Meade, 2010) so that the practical impact on scores can be judged.
6.2 How CFA and IRT parameters correspond
For ordinal indicators, CFA assumes a latent response variable X∗i = λiη + εi that is cut into categories by thresholds τik. With a probit link, P(Xi ≥ k | η) = Φ[(λiη − τik) / √θi], which is a normal-ogive graded response model with
ai = λi / √θi, bik = τik / λi (4)
When the latent response variable is standardised, θi = 1 − λi², and logistic discrimination is approximately 1.702 times the normal-ogive value (Embretson & Reise, 2000). This equivalence between the factor analysis of discretised variables and IRT is well established (Kamata & Bauer, 2008; McDonald, 1999; Takane & de Leeuw, 1987; Wirth & Edwards, 2007; Oladunmoye, 2026a). Table 2 summarises the correspondence, and Figure 2 shows why parameters cannot be compared at face value.
Table 2. Correspondence between ordinal CFA and the graded response model
Concept | Ordinal CFA | Graded response model | Caution |
|---|---|---|---|
Item-trait relation | Loading λi | Discrimination ai = λi / √θi | Non-linear; depends on residual variance and link |
Item location | Threshold τik | Location bik = τik / λi | Same threshold gives different b at different loadings |
Unique variance | Residual or scale factor | Absorbed into ai | No separate strict-invariance step in IRT |
Scale identification | Marker item, reference group, effects coding | Reference-group θ ~ N(0, 1), anchors | Identification choices alter parameter values |
Typical output | Global and incremental fit | Item-level tests, information, DIF effect sizes | Global fit can mask item-level DIF |
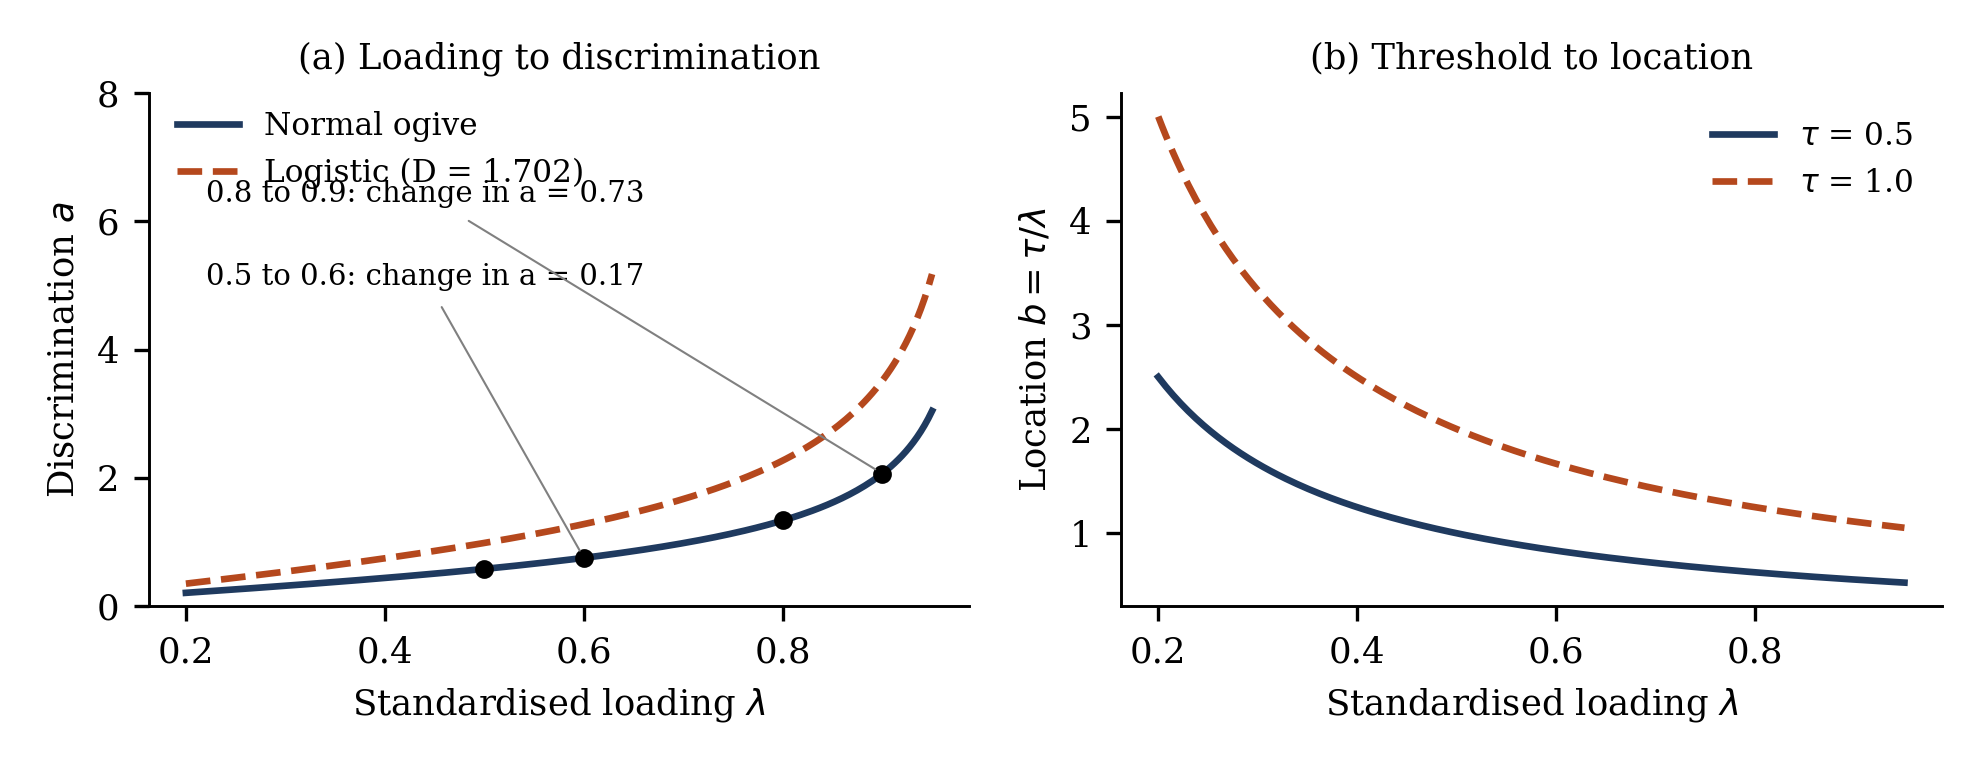
Figure 2. Relationship between CFA parameters and graded response model parameters under a standardised latent response variable. (a) The same difference in loading implies a much larger difference in discrimination when loadings are high. (b) A given threshold implies different item locations depending on the loading. Hypothetical values.
Two consequences follow. Equal loadings do not imply equal discrimination unless residual variances are also equal, and equal discrimination does not imply equal loadings. Moreover, because the relationship is non-linear, a small and unremarkable difference in loadings for a highly discriminating item can correspond to a large difference in the item response function.
6.3 What the comparative literature suggests
If ordinal CFA and the graded response model are the same model family, why do the procedures sometimes disagree? Several reasons are plausible: limited-information and full-information estimation, different identification and anchoring conventions, a global test in one tradition and item-level tests in the other, and different criteria for deciding that a difference matters. When CFA treats ordinal data as continuous, the models genuinely differ and misspecification may contribute. Reise et al. (1993) presented the two approaches as complementary, and Raju et al. (2002) compared the definitions of equivalence in each. Meade and Lautenschlager (2004) reported that the two methodologies did not lead to equivalent conclusions in all simulated conditions, and Stark et al. (2006) proposed a unified strategy based on nested model comparisons within either framework. The agreement or disagreement of the methods in applied settings, and in particular whether partial CFA invariance corresponds to localised IRT DIF, remains an empirical question that is returned to in Section 10.
7. An Integrated CFA and IRT Workflow
Figure 3 presents a staged workflow that organises the preceding material. It is a synthesis of existing procedures and a proposal for practice, not an empirically validated algorithm.
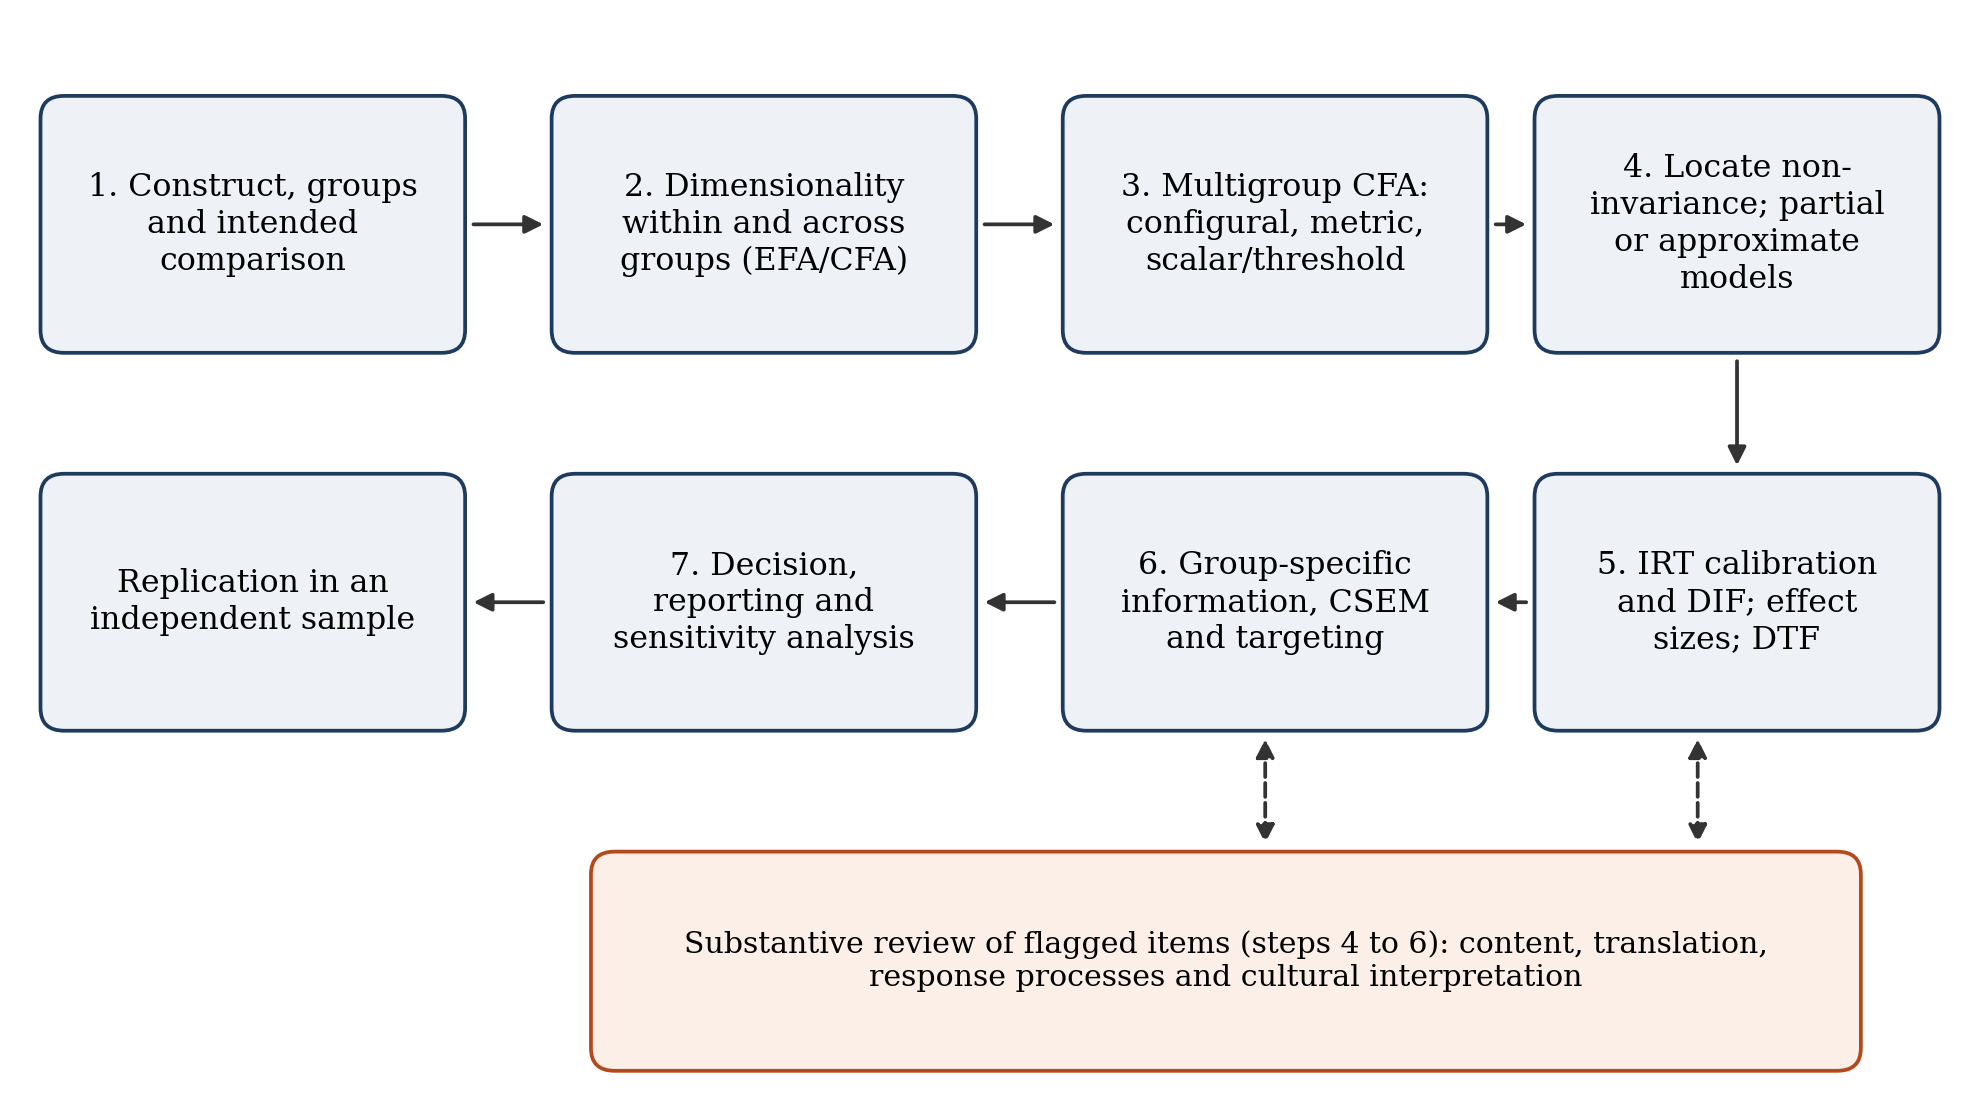
Figure 3. Proposed workflow combining multigroup CFA invariance testing, IRT-based DIF analysis, precision and targeting comparisons, and substantive review.
Stage 1: construct, groups and intended comparison. The construct, the groups and the comparison planned (means, relationships, change) determine the level of invariance that matters. Sample size per group and the amount of missing data should be considered at this stage.
Stage 2: dimensionality. Dimensionality is established within each group and jointly using exploratory and confirmatory methods, with bifactor or multidimensional models where justified. Unmodelled multidimensionality can generate apparent DIF (Ackerman, 1992) and so should be addressed before invariance conclusions are drawn.
Stage 3: multigroup CFA. Configural, metric and scalar or threshold models are estimated with an estimator suited to the data, and strict invariance only where the research question requires it. The identification strategy and fit criteria are specified in advance.
Stage 4: locating non-invariance. Non-invariant parameters are identified, their content examined, and partial or approximate models estimated where defensible. Sensitivity analyses compare substantive conclusions with and without freed parameters.
Stage 5: IRT calibration and DIF. An appropriate IRT model, for example the graded response model or generalised partial credit model (Muraki, 1992), is calibrated, DIF is tested with justified anchors, and effect sizes are computed. Results are compared with Stage 4 and any discrepancy is explained in terms of estimation, anchoring or criteria.
Stage 6: precision and targeting. Group-specific item and test information, conditional standard errors and the match between items and each group's trait distribution are compared (Section 7.1).
Stage 7: decision, reporting and replication. The report states which comparisons are supported, for which groups and items, and with what caveats. Replication in an independent sample is recommended for any solution that relied on post hoc modifications.
7.1 Measurement precision across groups
Invariance of structure and parameters does not guarantee that groups are measured with comparable precision. For the graded response model, item information is Ii(θ) = Σk [P′ik(θ)]² / Pik(θ), test information is the sum across items, and the conditional standard error of measurement is
CSEM(θ) = 1 / √IT(θ) (5)
Differences in test information between groups, IT,A(θ) − IT,B(θ), are a descriptive diagnostic and not a universal fairness statistic. Figure 4 shows the computed functions for the hypothetical scale. DIF in Items 2 and 3 reduces information for Group B, mostly at lower trait levels. The peak information is 4.28 for Group A and 3.91 for Group B, and at θ = −2 information falls from 2.96 to 2.39, so the conditional standard error rises from 0.58 to 0.65. Group B is also centred lower on the trait, so that the scale is somewhat less well targeted for it. Marginal reliability computed from these functions is about .80 for Group A and .77 for Group B, a modest difference that nonetheless conceals larger differences at specific trait levels. For screening or selection near a cut score, the conditional values are the relevant ones (Oladunmoye, 2026b).
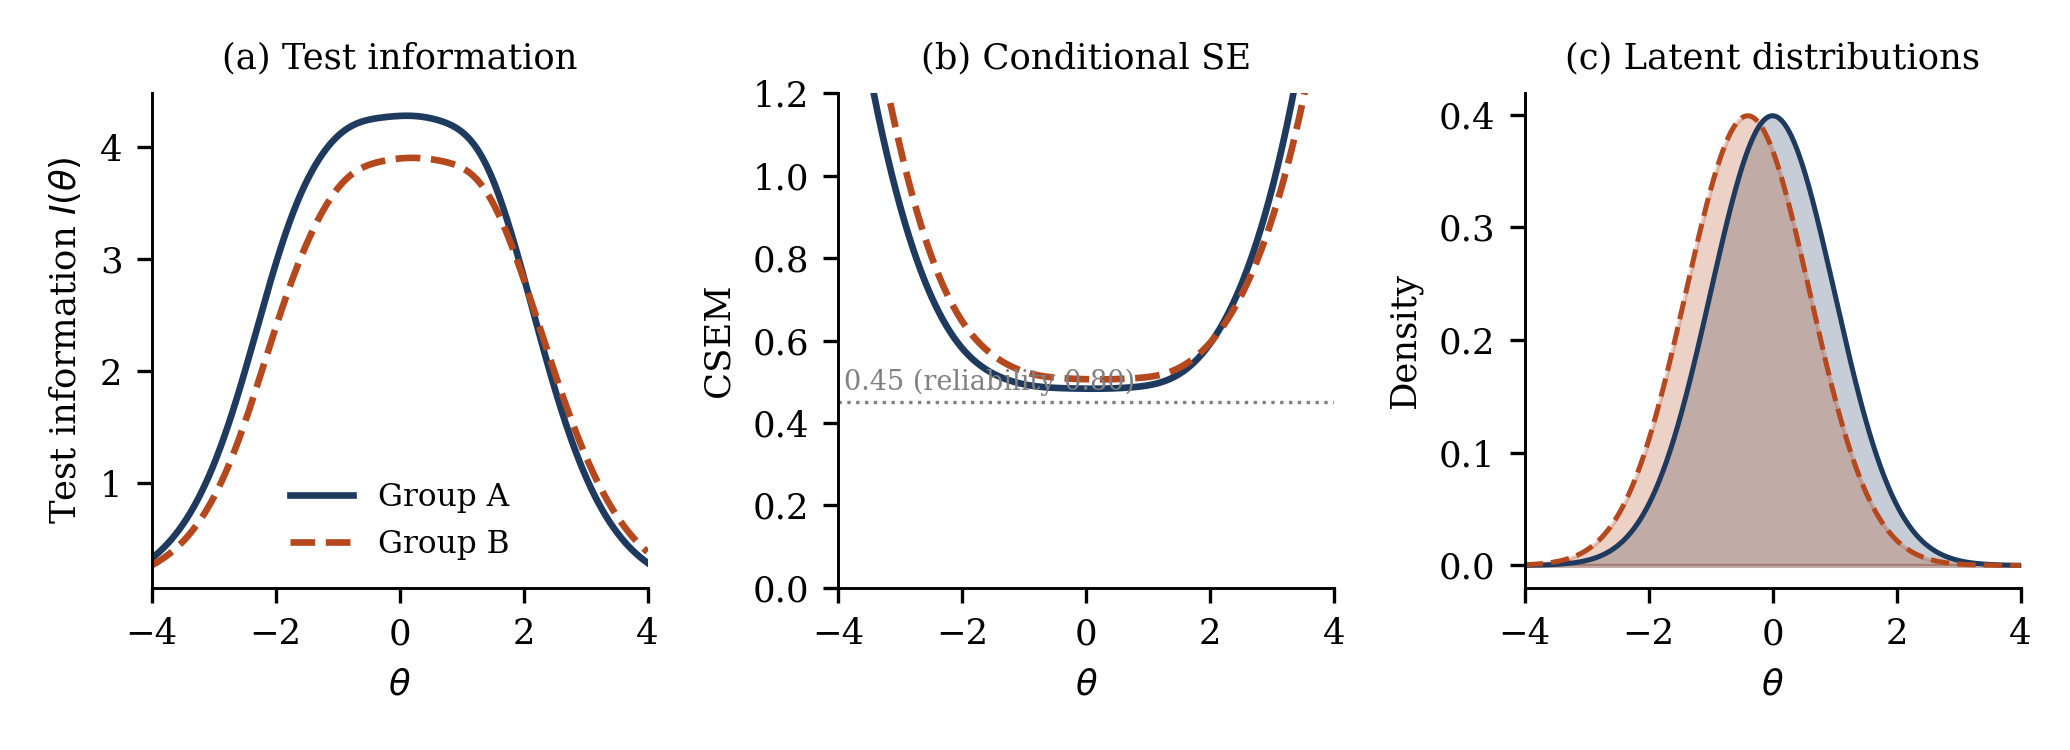
Figure 4. Group-specific (a) test information, (b) conditional standard error of measurement with a reference line at 0.45, corresponding to a reliability of .80 for a unit-variance trait, and (c) latent trait distributions. Computed from the hypothetical parameters in Appendix A.
Reliability coefficients should not be mistaken for evidence of invariance. Coefficients such as alpha or omega of .85 and .84 in two groups are compatible with different factor structures, loadings, thresholds or DIF patterns, because they summarise internal consistency under assumptions that are separate from cross-group equivalence (McDonald, 1999; Sijtsma, 2009).
8. Applications in Cross-Cultural and Longitudinal Research
8.1 Cross-cultural and multilingual measurement
Cross-cultural comparison adds sources of non-equivalence that statistical models cannot detect on their own. Van de Vijver and Tanzer (2004) distinguish construct, method and item bias, and Davidov et al. (2014) and Byrne and van de Vijver (2010) discuss how non-invariance should be handled in large cross-national datasets. Consider a resilience scale administered in Uganda, Kenya, Nigeria and South Africa. Configural invariance asks whether the same dimensions emerge, for example whether social support belongs to the same factor in all four settings. Metric and scalar questions follow, and with several countries, alignment or approximate invariance may be more workable than exact equality. Within a country, language can be the grouping variable, for example English, Luganda and Kiswahili versions, and DIF analysis can then be applied to each pair of language versions.
Translation quality is a precondition and not a substitute for equivalence evidence. Current guidance recommends committee-based adaptation, pretesting and cognitive interviewing in addition to, rather than instead of, back-translation (Beaton et al., 2000; Brislin, 1970; International Test Commission, 2017; Willis, 2005). Response styles such as acquiescence and extreme responding can also masquerade as non-invariance (Cheung & Rensvold, 2000). A well-translated scale can still show non-invariance, and statistical invariance does not prove conceptual equivalence, so quantitative evidence should be combined with qualitative and cultural review.
8.2 Longitudinal invariance and response shift
Measurement invariance across occasions is needed to interpret change. The longitudinal models require correlated residuals for the same item across time and a sequence of constraints parallel to the multigroup case (Widaman et al., 2010), with adaptations for ordinal indicators (Liu et al., 2017). In intervention research, respondents may reconceptualise the construct after treatment, a phenomenon known as response shift (Sprangers & Schwartz, 1999), and structural equation approaches can help to separate response shift from true change (Oort, 2005). Item-level IRT analyses across time can show whether a particular item changed in discrimination or location.
8.3 Structural comparisons
Comparisons of structural relations across groups, such as the path from one latent variable to another, require at least metric invariance, and comparisons of latent means require scalar invariance. A claim that gender moderates a relationship is therefore ambiguous unless the measurement of both variables is comparable across gender. The sequence is measurement model, then invariance, then group comparison, not the reverse.
9. Common Pitfalls and Reporting Standards
Table 3. Common pitfalls and suggested remedies
Pitfall | Why it matters | Remedy |
|---|---|---|
Comparing means before testing invariance | Observed differences mix construct and measurement differences (Eq. 2) | Establish the level required for the comparison first |
Taking similar alpha or omega as invariance | Reliability is separate from equivalence | Test invariance explicitly |
Requiring strict invariance by default | Not needed for latent mean comparison | Match the level to the research question |
Treating failure of full invariance as total failure | Partial or approximate models may support comparison | Examine pattern, size and consequences |
Freeing parameters by modification index alone | Capitalisation on chance | Require substantive justification and replication |
Equating loadings with IRT discrimination | Relationship depends on residual variance and link | Use the transformations in Eq. 4 |
Ignoring ordinal thresholds | Distorted loadings and intercepts | Use categorical estimators and threshold invariance |
Ignoring precision | Equal structure does not imply equal information | Compare TIF, CSEM and targeting |
Treating invariance as a yes or no label | Hides item, parameter and group detail | Report groups, level, items and intended comparison |
Reporting of invariance analyses is often incomplete (Putnick & Bornstein, 2016). Table 4 lists elements that, taken together with the checklist of van de Schoot et al. (2012) and the R workflows described by Fischer and Karl (2019), would allow readers to evaluate and replicate an analysis.
Table 4. Minimum reporting checklist
Element | Content to report |
|---|---|
Construct and groups | Theoretical definition, group definitions, sample sizes, missing data handling |
Measurement model | Factor structure, estimator, identification strategy, treatment of ordinal data |
Invariance sequence | Models tested, fit statistics, criteria used and their source, and the rationale for stopping |
Non-invariant parameters | Which parameters, direction, size, and effect-size indices |
Partial or approximate models | Constraints released, justification, sensitivity of conclusions |
IRT and DIF | Model, anchors, test used, effect sizes, treatment of multiple testing |
Precision and targeting | Group-specific information and CSEM, trait distributions |
Interpretation | Comparisons supported and not supported, and substantive and cultural evidence |
Software and code | Packages and versions, for example lavaan (Rosseel, 2012), semTools (Jorgensen et al., 2022), mirt (Chalmers, 2012) |
10. Limitations and Directions for Research
This note has several limitations. It is a selective narrative synthesis, not a systematic review. The illustrations rely on hypothetical parameters and show how quantities behave, not how often procedures succeed. The workflow has not been validated, and the note does not cover multidimensional DIF, mixture approaches or Bayesian IRT in detail. The cut-offs cited are conditional on the simulation designs from which they came.
Three lines of research follow from the synthesis. First, simulation studies should manipulate loading and threshold differences, discrimination and location differences, sample size, group imbalance, number of groups, dimensionality and DIF magnitude, and compare the detection rates of CFA-based and IRT-based procedures under ordinal estimation. Second, applied studies should analyse the same dataset with both procedures, for example for instruments adapted into African languages, and examine whether partial CFA invariance corresponds to localised DIF and whether culturally informed item revision reduces DIF without reducing information. Third, workflows that report group-specific information and targeting routinely, and software that supports them, should be evaluated for their effect on the quality of reporting. Implementation within the PsychtrixWeb platform is one such planned application.
11. Conclusion
Measurement invariance is a precondition for meaningful comparison, and no single statistic establishes it. The CFA hierarchy and the IRT concept of DIF address related questions in related model families, and their numerical parameters are linked by transformations that depend on residual variance and link function. Differences between the procedures are often attributable to estimation, identification and decision criteria rather than to different constructs. Researchers who combine the two perspectives, examine precision as well as structure, and tie the required level of invariance to the intended comparison are better placed to defend their conclusions. The question to ask is not whether a scale passes a test but whether the intended interpretation of its scores is defensible for the groups or occasions being compared. A natural next step is the use of item information, targeting and invariance evidence in computerised adaptive testing, where item selection is individualised.
Appendix A. Hypothetical Item Parameters Used in the Illustrations
Graded response model, five categories. Group A is the reference group. Group B parameters equal Group A parameters except where marked.
Item | aA | b1, b2, b3, b4 (Group A) | aB | Group B thresholds |
|---|---|---|---|---|
1 | 1.90 | −1.8, −0.8, 0.2, 1.2 | 1.90 | Same |
2 | 1.50 | −1.5, −0.5, 0.5, 1.5 | 1.50 | −0.8, 0.2, 1.2, 2.2 (uniform DIF) |
3 | 1.30 | −2.0, −1.0, 0.0, 1.0 | 0.70 | Same (non-uniform DIF) |
4 | 1.70 | −1.2, −0.3, 0.6, 1.5 | 1.70 | Same |
5 | 1.10 | −1.6, −0.6, 0.4, 1.4 | 1.10 | Same |
6 | 1.50 | −0.8, 0.1, 1.0, 1.9 | 1.50 | Same |
References
- Ackerman, T. A. (1992). A didactic explanation of item bias, item impact, and item validity from a multidimensional perspective. Journal of Educational Measurement, 29(1), 67-91. https://doi.org/10.1111/j.1745-3984.1992.tb00368.x
- American Educational Research Association, American Psychological Association, & National Council on Measurement in Education. (2014). Standards for educational and psychological testing. American Educational Research Association.
- Asparouhov, T., & Muthén, B. (2014). Multiple-group factor analysis alignment. Structural Equation Modeling, 21(4), 495-508. https://doi.org/10.1080/10705511.2014.919210
- Bauer, D. J. (2017). A more general model for testing measurement invariance and differential item functioning. Psychological Methods, 22(3), 507-526. https://doi.org/10.1037/met0000077
- Beaton, D. E., Bombardier, C., Guillemin, F., & Ferraz, M. B. (2000). Guidelines for the process of cross-cultural adaptation of self-report measures. Spine, 25(24), 3186-3191. https://doi.org/10.1097/00007632-200012150-00014
- Borsboom, D. (2006). When does measurement invariance matter? Medical Care, 44(11, Suppl. 3), S176-S181. https://doi.org/10.1097/01.mlr.0000245143.08679.cc
- Brislin, R. W. (1970). Back-translation for cross-cultural research. Journal of Cross-Cultural Psychology, 1(3), 185-216. https://doi.org/10.1177/135910457000100301
- Byrne, B. M., & van de Vijver, F. J. R. (2010). Testing for measurement and structural equivalence in large-scale cross-cultural studies: Addressing the issue of nonequivalence. International Journal of Testing, 10(2), 107-132. https://doi.org/10.1080/15305051003637306
- Byrne, B. M., Shavelson, R. J., & Muthén, B. (1989). Testing for the equivalence of factor covariance and mean structures: The issue of partial measurement invariance. Psychological Bulletin, 105(3), 456-466. https://doi.org/10.1037/0033-2909.105.3.456
- Chalmers, R. P. (2012). mirt: A multidimensional item response theory package for the R environment. Journal of Statistical Software, 48(6), 1-29. https://doi.org/10.18637/jss.v048.i06
- Chalmers, R. P., Counsell, A., & Flora, D. B. (2016). It might not make a big DIF: Improved differential test functioning statistics that account for sampling variability. Educational and Psychological Measurement, 76(1), 114-140. https://doi.org/10.1177/0013164415584576
- Chen, F. F. (2007). Sensitivity of goodness of fit indexes to lack of measurement invariance. Structural Equation Modeling, 14(3), 464-504. https://doi.org/10.1080/10705510701301834
- Cheung, G. W., & Rensvold, R. B. (2000). Assessing extreme and acquiescence response sets in cross-cultural research using structural equations modeling. Journal of Cross-Cultural Psychology, 31(2), 187-212. https://doi.org/10.1177/0022022100031002003
- Cheung, G. W., & Rensvold, R. B. (2002). Evaluating goodness-of-fit indexes for testing measurement invariance. Structural Equation Modeling, 9(2), 233-255. https://doi.org/10.1207/S15328007SEM0902_5
- Cieciuch, J., Davidov, E., Schmidt, P., Algesheimer, R., & Schwartz, S. H. (2014). Comparing results of an exact vs. an approximate (Bayesian) measurement invariance test: A cross-country illustration with a scale to measure 19 human values. Frontiers in Psychology, 5, Article 982. https://doi.org/10.3389/fpsyg.2014.00982
- Davidov, E., Meuleman, B., Cieciuch, J., Schmidt, P., & Billiet, J. (2014). Measurement equivalence in cross-national research. Annual Review of Sociology, 40, 55-75. https://doi.org/10.1146/annurev-soc-071913-043137
- Embretson, S. E., & Reise, S. P. (2000). Item response theory for psychologists. Lawrence Erlbaum Associates.
- Fischer, R., & Karl, J. A. (2019). A primer to (cross-cultural) multi-group invariance testing possibilities in R. Frontiers in Psychology, 10, Article 1507. https://doi.org/10.3389/fpsyg.2019.01507
- French, B. F., & Finch, W. H. (2006). Confirmatory factor analytic procedures for the determination of measurement invariance. Structural Equation Modeling, 13(3), 378-402.
- Holland, P. W., & Wainer, H. (Eds.). (1993). Differential item functioning. Lawrence Erlbaum Associates.
- Horn, J. L., & McArdle, J. J. (1992). A practical and theoretical guide to measurement invariance in aging research. Experimental Aging Research, 18(3), 117-144. https://doi.org/10.1080/03610739208253916
- International Test Commission. (2017). The ITC guidelines for translating and adapting tests (2nd ed.). https://www.InTestCom.org
- Jöreskog, K. G. (1971). Simultaneous factor analysis in several populations. Psychometrika, 36(4), 409-426. https://doi.org/10.1007/BF02291366
- Jorgensen, T. D., Pornprasertmanit, S., Schoemann, A. M., & Rosseel, Y. (2022). semTools: Useful tools for structural equation modeling (R package). https://CRAN.R-project.org/package=semTools
- Kamata, A., & Bauer, D. J. (2008). A note on the relation between factor analytic and item response theory models. Structural Equation Modeling, 15(1), 136-153. https://doi.org/10.1080/10705510701758406
- Li, C.-H. (2016). Confirmatory factor analysis with ordinal data: Comparing robust maximum likelihood and diagonally weighted least squares. Behavior Research Methods, 48(3), 936-949. https://doi.org/10.3758/s13428-015-0619-7
- Liu, Y., Millsap, R. E., West, S. G., Tein, J.-Y., Tanaka, R., & Grimm, K. J. (2017). Testing measurement invariance in longitudinal data with ordered-categorical measures. Psychological Methods, 22(3), 486-506. https://doi.org/10.1037/met0000075
- Lubke, G. H., & Muthén, B. O. (2004). Applying multigroup confirmatory factor models for continuous outcomes to Likert scale data complicates meaningful group comparisons. Structural Equation Modeling, 11(4), 514-534. https://doi.org/10.1207/s15328007sem1104_2
- MacCallum, R. C., Roznowski, M., & Necowitz, L. B. (1992). Model modifications in covariance structure analysis: The problem of capitalization on chance. Psychological Bulletin, 111(3), 490-504. https://doi.org/10.1037/0033-2909.111.3.490
- Marsh, H. W., Guo, J., Parker, P. D., Nagengast, B., Asparouhov, T., Muthén, B., & Dicke, T. (2018). What to do when scalar invariance fails: The extended alignment method for multi-group factor analysis comparison of latent means across many groups. Psychological Methods, 23(3), 524-545. https://doi.org/10.1037/met0000113
- McDonald, R. P. (1999). Test theory: A unified treatment. Lawrence Erlbaum Associates.
- Meade, A. W. (2010). A taxonomy of effect size measures for the differential functioning of items and scales. Journal of Applied Psychology, 95(4), 728-743. https://doi.org/10.1037/a0018966
- Meade, A. W., & Lautenschlager, G. J. (2004). A comparison of item response theory and confirmatory factor analytic methodologies for establishing measurement equivalence/invariance. Organizational Research Methods, 7(4), 361-388. https://doi.org/10.1177/1094428104268027
- Meade, A. W., Johnson, E. C., & Braddy, P. W. (2008). Power and sensitivity of alternative fit indices in tests of measurement invariance. Journal of Applied Psychology, 93(3), 568-592. https://doi.org/10.1037/0021-9010.93.3.568
- Mellenbergh, G. J. (1989). Item bias and item response theory. International Journal of Educational Research, 13(2), 127-143. https://doi.org/10.1016/0883-0355(89)90002-5
- Meredith, W. (1993). Measurement invariance, factor analysis and factorial invariance. Psychometrika, 58(4), 525-543. https://doi.org/10.1007/BF02294825
- Millsap, R. E. (2007). Invariance in measurement and prediction revisited. Psychometrika, 72(4), 461-473.
- Millsap, R. E. (2011). Statistical approaches to measurement invariance. Routledge.
- Millsap, R. E., & Kwok, O.-M. (2004). Evaluating the impact of partial factorial invariance on selection in two populations. Psychological Methods, 9(1), 93-115. https://doi.org/10.1037/1082-989X.9.1.93
- Millsap, R. E., & Olivera-Aguilar, M. (2012). Investigating measurement invariance using confirmatory factor analysis. In R. H. Hoyle (Ed.), Handbook of structural equation modeling (pp. 380-392). Guilford Press.
- Millsap, R. E., & Yun-Tein, J. (2004). Assessing factorial invariance in ordered-categorical measures. Multivariate Behavioral Research, 39(3), 479-515. https://doi.org/10.1207/S15327906MBR3903_4
- Muraki, E. (1992). A generalized partial credit model: Application of an EM algorithm. Applied Psychological Measurement, 16(2), 159-176. https://doi.org/10.1177/014662169201600206
- Muthén, B. (1984). A general structural equation model with dichotomous, ordered categorical, and continuous latent variable indicators. Psychometrika, 49(1), 115-132. https://doi.org/10.1007/BF02294210
- Muthén, B., & Asparouhov, T. (2012). Bayesian structural equation modeling: A more flexible representation of substantive theory. Psychological Methods, 17(3), 313-335. https://doi.org/10.1037/a0026802
- Muthén, B., & Asparouhov, T. (2018). Recent methods for the study of measurement invariance with many groups: Alignment and random effects. Sociological Methods & Research, 47(4), 637-664. https://doi.org/10.1177/0049124117701488
- Nye, C. D., & Drasgow, F. (2011). Effect size indices for analyses of measurement equivalence: Understanding the practical importance of differences between groups. Journal of Applied Psychology, 96(5), 966-980. https://doi.org/10.1037/a0022955
- Oladunmoye, E. O. (2026d). Exploratory Factor Analysis Versus Confirmatory Factor Analysis. PsychtrixWeb Research Note, 007. Psychtrix Initiative Limited. https://www.psychtrixweb.online/research-notes/007-abstract-3
- Oladunmoye, E. O. (2026e). From Questionnaire to Validated Instrument: A Complete Psychometric Analysis Workflow Using PsychtrixWeb. PsychtrixWeb Research Note, 006. Psychtrix Initiative Limited. https://www.psychtrixweb.online/research-notes/006-1-introduction-2
- Oladunmoye, E. O., (2015). Development and validation of social provision scale on first year undergraduate psychological adjustment. Journal of Education and Practice, 6 (28), 78-90.
- Oladunmoye, E. O., Muhammad T. S., (2024). Development and Validation of Multiple Intelligence Test among emerging adults in the United Kingdom. ISAR Journal of Arts, Humanities and Social Sciences, 2(4), 18-24.
- Oladunmoye, E.O., Agbor, E.C., Olabisi, O.L., and Oyadeyi, J.B., (2024). Estimating measurement invariance on emotional intelligence scale across gender and age among undergraduates in Nigeria. Thinking Skills and Creativity Journal. 7(1),50-60
- Oladunmoye, E.O., Enamudu, G.P., Sa'ad, M.T. (2024). A Differential Item Functioning estimate of WAEC Mathematics test form based on gender and age among secondary school students. ISAR Journal of Multidisciplinary Research and Studies, 2(5), 15-21.
- Oort, F. J. (2005). Using structural equation modeling to detect response shifts and true change. Quality of Life Research, 14(3), 587-598. https://doi.org/10.1007/s11136-004-0830-y
- Oyedele, L. O., Oladunmoye, E. O., Obi, S. N., & Nakalema, F. (2025). The differential role of age and gender on the mental health of Nigerian healthcare workers. African Multidisciplinary Journal of Development (AMJD), 14(1), 85–91.
- Putnick, D. L., & Bornstein, M. H. (2016). Measurement invariance conventions and reporting: The state of the art and future directions for psychological research. Developmental Review, 41, 71-90. https://doi.org/10.1016/j.dr.2016.06.004
- Raju, N. S., Laffitte, L. J., & Byrne, B. M. (2002). Measurement equivalence: A comparison of methods based on confirmatory factor analysis and item response theory. Journal of Applied Psychology, 87(3), 517-529. https://doi.org/10.1037/0021-9010.87.3.517
- Reise, S. P., Widaman, K. F., & Pugh, R. H. (1993). Confirmatory factor analysis and item response theory: Two approaches for exploring measurement invariance. Psychological Bulletin, 114(3), 552-566. https://doi.org/10.1037/0033-2909.114.3.552
- Rhemtulla, M., Brosseau-Liard, P. É., & Savalei, V. (2012). When can categorical variables be treated as continuous? A comparison of robust continuous and categorical SEM estimation methods under suboptimal conditions. Psychological Methods, 17(3), 354-373. https://doi.org/10.1037/a0029315
- Rosseel, Y. (2012). lavaan: An R package for structural equation modeling. Journal of Statistical Software, 48(2), 1-36. https://doi.org/10.18637/jss.v048.i02
- Rutkowski, L., & Svetina, D. (2014). Assessing the hypothesis of measurement invariance in the context of large-scale international surveys. Educational and Psychological Measurement, 74(1), 31-57. https://doi.org/10.1177/0013164413498257
- Samejima, F. (1969). Estimation of latent ability using a response pattern of graded scores. Psychometrika Monograph Supplement, 34(4, Pt. 2), 1-97.
- Sijtsma, K. (2009). On the use, the misuse, and the very limited usefulness of Cronbach's alpha. Psychometrika, 74(1), 107-120. https://doi.org/10.1007/s11336-008-9101-0
- Sörbom, D. (1974). A general method for studying differences in factor means and factor structure between groups. British Journal of Mathematical and Statistical Psychology, 27(2), 229-239. https://doi.org/10.1111/j.2044-8317.1974.tb00543.x
- Sprangers, M. A. G., & Schwartz, C. E. (1999). Integrating response shift into health-related quality of life research: A theoretical model. Social Science & Medicine, 48(11), 1507-1515. https://doi.org/10.1016/S0277-9536(99)00045-3
- Stark, S., Chernyshenko, O. S., & Drasgow, F. (2006). Detecting differential item functioning with confirmatory factor analysis and item response theory: Toward a unified strategy. Journal of Applied Psychology, 91(6), 1292-1306. https://doi.org/10.1037/0021-9010.91.6.1292
- Steenkamp, J.-B. E. M., & Baumgartner, H. (1998). Assessing measurement invariance in cross-national consumer research. Journal of Consumer Research, 25(1), 78-90. https://doi.org/10.1086/209528
- Swaminathan, H., & Rogers, H. J. (1990). Detecting differential item functioning using logistic regression procedures. Journal of Educational Measurement, 27(4), 361-370. https://doi.org/10.1111/j.1745-3984.1990.tb00754.x
- Takane, Y., & de Leeuw, J. (1987). On the relationship between item response theory and factor analysis of discretized variables. Psychometrika, 52(3), 393-408. https://doi.org/10.1007/BF02294363
- Thissen, D., Steinberg, L., & Wainer, H. (1993). Detection of differential item functioning using the parameters of item response models. In P. W. Holland & H. Wainer (Eds.), Differential item functioning (pp. 67-113). Lawrence Erlbaum Associates.
- van de Schoot, R., Kluytmans, A., Tummers, L., Lugtig, P., Hox, J., & Muthén, B. (2013). Facing off with Scylla and Charybdis: A comparison of scalar, partial, and the novel possibility of approximate measurement invariance. Frontiers in Psychology, 4, Article 770. https://doi.org/10.3389/fpsyg.2013.00770
- van de Schoot, R., Lugtig, P., & Hox, J. (2012). A checklist for testing measurement invariance. European Journal of Developmental Psychology, 9(4), 486-492. https://doi.org/10.1080/17405629.2012.686740
- van de Vijver, F. J. R., & Tanzer, N. K. (2004). Bias and equivalence in cross-cultural assessment: An overview. European Review of Applied Psychology, 54(2), 119-135. https://doi.org/10.1016/j.erap.2003.12.004
- Vandenberg, R. J., & Lance, C. E. (2000). A review and synthesis of the measurement invariance literature: Suggestions, practices, and recommendations for organizational research. Organizational Research Methods, 3(1), 4-70. https://doi.org/10.1177/109442810031002
- Widaman, K. F., & Reise, S. P. (1997). Exploring the measurement invariance of psychological instruments: Applications in the substance use domain. In K. J. Bryant, M. Windle, & S. G. West (Eds.), The science of prevention: Methodological advances from alcohol and substance abuse research (pp. 281-324). American Psychological Association.
- Widaman, K. F., Ferrer, E., & Conger, R. D. (2010). Factorial invariance within longitudinal structural equation models: Measuring the same construct across time. Child Development Perspectives, 4(1), 10-18. https://doi.org/10.1111/j.1750-8606.2009.00110.x
- Willis, G. B. (2005). Cognitive interviewing: A tool for improving questionnaire design. Sage.
- Wirth, R. J., & Edwards, M. C. (2007). Item factor analysis: Current approaches and future directions. Psychological Methods, 12(1), 58-79. https://doi.org/10.1037/1082-989X.12.1.58
- Woods, C. M. (2009). Empirical selection of anchors for tests of differential item functioning. Applied Psychological Measurement, 33(1), 42-57. https://doi.org/10.1177/0146621607314044
- Wu, H., & Estabrook, R. (2016). Identification of confirmatory factor analysis models of different levels of invariance for ordered categorical outcomes. Psychometrika, 81(4), 1014-1045. https://doi.org/10.1007/s11336-016-9506-0
- Yoon, M., & Millsap, R. E. (2007). Detecting violations of factorial invariance using data-based specification searches: A Monte Carlo study. Structural Equation Modeling, 14(3), 435-463. https://doi.org/10.1080/10705510701301677
- Zumbo, B. D. (2007). Three generations of DIF analyses: Considering where it has been, where it is now, and where it is going. Language Assessment Quarterly, 4(2), 223-233. https://doi.org/10.1080/15434300701375832.
Suggested citation
Oladunmoye, E. O. (2026). Measurement Invariance Across Groups: Connecting Confirmatory Factor Analytic and Item Response Theory Perspectives. PsychtrixWeb Research Note, 018. Psychtrix Initiative Limited. https://doi.org/10.5281/zenodo.23224476Discuss this Research Note
Scholarly comments are welcome from anyone — no account required. Contributions are moderated before they appear.
No comments yet. Start the scholarly discussion below.