
Item Information Functions in Item Response Theory: A Conceptual and Methodological Review of Measurement Precision
Abstract
Item response theory (IRT) offers a substantial advantage over classical test theory by allowing measurement precision to vary across the latent trait continuum rather than assuming a single, constant level of reliability for all respondents. Central to this advantage is the item information function (IIF), which quantifies the amount of statistical information an item contributes to the estimation of the latent trait, θ, at each point along the trait continuum. This review synthesises the conceptual, mathematical and applied foundations of item information functions for researchers working with dichotomous and polytomous item response models. It distinguishes the IIF from the item characteristic curve, the test information function, classical reliability coefficients and validity evidence, and it demonstrates the inverse relationship between information and the conditional standard error of measurement. Using a worked numerical example based on three two-parameter logistic items, the review illustrates how discrimination and item location jointly determine where an item measures most precisely, and how individual item information functions aggregate into a test information function under local independence. Applications to scale development, short-form construction, computerised adaptive testing and differential item functioning are discussed, together with common misconceptions, notably the assumption that the item with the largest discrimination parameter is necessarily the most useful item. The review concludes with recommendations for reporting information-based evidence in empirical psychometric research and for embedding information analysis within broader validity and fairness frameworks.
1. Introduction
A fundamental question in psychological and educational measurement is how precisely an instrument measures a person at a particular level of the trait it is intended to assess. Classical test theory typically summarises measurement precision using a single reliability coefficient that is treated as constant across the full range of the trait. Item response theory (IRT) approaches this question differently: rather than assuming uniform precision for every respondent, IRT allows precision to vary continuously across the latent trait continuum, θ. This property is formalised through information functions. Lord's (1980) foundational treatment of IRT was among the first to develop the concepts of item and test information for practical test development and ability estimation, and later work has continued to demonstrate their value for psychometric practice (Oladunmoye, Enamudu, & Sa'ad, 2024; Baker, 2001; Embretson & Reise, 2000; Hambleton, Swaminathan, & Rogers, 1991).
More recent applications reinforce that item information functions identify the regions of the latent continuum in which individual items provide measurement precision, while the test information function aggregates information across an entire instrument (Reise & Waller, 2003). This review synthesises the conceptual, mathematical and applied interpretation of item information functions for researchers using IRT in educational, psychological, clinical, organisational and social science research. It clarifies the relationship between discrimination, item location, information and the conditional standard error of measurement, and it distinguishes the item information function (IIF) from the item characteristic curve (ICC), the test information function (TIF), classical reliability and validity evidence more broadly. Applications to scale development, item selection, short-form construction, computerised adaptive testing (CAT) and differential item functioning (DIF) are considered throughout. For a comprehensive general treatment of item response theory, readers are referred to Embretson and Reise (2000), Hambleton et al. (1991) and De Ayala (2009).
Particular attention is given to a common misconception in applied practice, namely that the item with the highest discrimination parameter is automatically the most useful item. As this review demonstrates, item usefulness depends jointly on discrimination and on where along the latent continuum precision is actually required for the intended use of the instrument.
2. Distinguishing the Item Characteristic Curve from the Item Information Function
The item characteristic curve (ICC) describes the relationship between the latent trait and the probability of a particular response, that is, θ mapped to P(X = 1 | θ). The item information function poses a different question: how much statistical information does the item provide about θ at a given point on the continuum, that is, θ mapped to Iᵢ(θ). The ICC therefore describes how an item behaves, whereas the IIF describes where that item measures with the greatest precision.
This distinction, although conceptually straightforward, is frequently overlooked in applied psychometric practice, where an item's discrimination parameter alone is sometimes treated as a proxy for overall item quality (Baker, 2001; Hambleton et al., 1991). As later sections illustrate, two items can share an identical ICC slope yet provide their greatest measurement precision at very different points on the trait continuum, depending on where each item is located.
3. Mathematical Formulation of Item Information
Information in the sense used throughout IRT draws on the classical statistical concept of Fisher information: the amount of information that an observed response provides about the location of an individual on the latent continuum, formally derived from the second derivative of the log likelihood of the response with respect to θ (Lord, 1980; Baker & Kim, 2004). Higher information corresponds to a steeper local slope of the response function and therefore to greater precision in the corresponding region of the trait continuum, an inverse relationship that is central to IRT and is developed formally below.
3.1 Information under the one- and two-parameter logistic models
Under the one-parameter logistic, or Rasch, model, item discrimination is constrained to be equal across all items (Rasch, 1960). The more general two-parameter logistic (2PL) model allows discrimination to vary across items and gives the probability of endorsing or correctly answering item i as:
Pi(θ) = 1 / {1 + exp[−ai(θ − bi)]} (1)
where aᵢ is the discrimination parameter and bᵢ is the location, or difficulty, parameter of item i (Birnbaum, 1968). For dichotomously scored items following the 2PL model, the item information function can be expressed as:
Ii(θ) = ai2 Pi(θ)[1 − Pi(θ)] = ai2 Pi(θ) Qi(θ) (2)
where Qᵢ(θ) = 1 − Pᵢ(θ) (Baker, 2001; Hambleton et al., 1991). This expression is also implemented directly in widely used IRT software (Chalmers, 2012; Rizopoulos, 2006).
Because information is proportional to the square of the discrimination parameter, discrimination exerts a strong multiplicative influence on the amount of information an item can provide. An item with a discrimination of 2.00 can reach four times the peak information of an otherwise identical item with a discrimination of 1.00, and an item with a discrimination of 3.00 can reach nine times that peak. This does not imply, however, that the item with the largest discrimination parameter is always the most useful item, because the location of that information, governed by bᵢ, matters equally. For the one- and two-parameter logistic models, maximum information occurs at θ = bᵢ, where Pᵢ(θ) = 0.50, giving a peak information value of aᵢ²/4 (Hambleton et al., 1991). An item with a location of −2.00 therefore concentrates its information in the lower region of the trait continuum, whereas an item with a location of +2.00 concentrates its information in the upper region, even when both items share an identical discrimination parameter.
3.2 Information under the three- and four-parameter logistic models
The three-parameter logistic (3PL) model introduces a lower asymptote, cᵢ, that accommodates guessing on multiple-choice items, such that Pᵢ(θ) = cᵢ + (1 − cᵢ)Pᵢ*(θ), where Pᵢ*(θ) denotes the two-parameter logistic component. The corresponding item information function is given by:
Ii(θ) = ai2 [Qi(θ)/Pi(θ)] × {[Pi(θ) − ci]/(1 − ci)}2 (3)
which reduces to the familiar 2PL expression when cᵢ = 0 (Lord, 1980; Baker & Kim, 2004). The four-parameter logistic (4PL) model additionally introduces an upper asymptote to accommodate slipping, and requires a further generalisation of the information function (Loken & Rulison, 2010). A recurring analytic error in applied work is to apply the simpler 2PL information formula indiscriminately to items estimated under a 3PL or 4PL model. Because a non-zero lower or upper asymptote reduces the amount of information an item can provide at a given discrimination and location, this substitution can materially overstate measurement precision, particularly towards the lower end of the trait continuum. Figure 4 illustrates this effect directly.
3.3 Information for polytomous response models
The concept of item information extends to the ordered polytomous response formats common in psychological and health-related measurement, including the graded response model (Samejima, 1969), the partial credit model (Masters, 1982) and the generalised partial credit model (Muraki, 1992). In these models, item information is obtained by summing the contribution of each response category, weighted by the probability of that category and its associated slope, across the trait continuum (Embretson & Reise, 2000; Ostini & Nering, 2006). Because category functioning directly affects the resulting information function, researchers should inspect category response curves and threshold ordering before treating item-level information as evidence of sound measurement, since disordered thresholds or poorly differentiated response categories can substantially reduce the information a polytomous item contributes (Ostini & Nering, 2006).
4. From Item Information to Test Information and Conditional Standard Error
Under the assumption of local independence, that is, that item responses are conditionally independent given θ, item information is additive (Lord, 1980). Summing item information across the k items of an instrument produces the test information function:
IT(θ) = Σ(for i = 1 to k) Ii(θ) (4)
The test information function (TIF) describes how precisely the entire instrument measures the trait at each point along the continuum, and it is related to the conditional standard error of measurement by:
SE(θ) = 1 / √IT(θ) (5)
Because the standard error is an inverse square-root function of information, a fourfold increase in information corresponds to only a halving of the standard error. For example, an information value of 1 gives a standard error of 1.00, an information value of 4 gives a standard error of 0.50, a value of 9 gives 0.33 and a value of 16 gives 0.25. This relationship links an abstract statistical quantity to a practically interpretable metric of measurement precision, and it underlies large-sample confidence intervals of the form θ̂ ± 1.96 SE(θ̂) for a nominal 95 per cent interval, subject to the usual caveats regarding the estimator, the model and any boundary conditions on θ (Lord, 1980).
A key implication of this framework is that a single global reliability coefficient can conceal considerable variation in precision across the trait continuum. A scale with excellent internal consistency, for example a Cronbach's alpha of .92, may nonetheless provide markedly better precision near the centre of the distribution than at its extremes, a pattern that classical reliability indices do not, by design, reveal (Oladunmoye, 2026i; Embretson & Reise, 2000; Reise & Waller, 2003).
5. Illustrative Example
To illustrate these relationships concretely, consider three dichotomously scored items following the 2PL model, each with identical discrimination (a = 1.50) but different locations: Item A (b = −1.50), Item B (b = 0.00) and Item C (b = +1.50). Table 1 summarises the resulting peak information values, all of which equal a²/4 = 0.5625 because discrimination is held constant, together with the trait level at which each item's information peaks.
Table 1. Parameters and peak information for three illustrative 2PL items.
Item | a | b | Peak information, aᵢ²/4 | θ at peak |
|---|---|---|---|---|
A | 1.50 | −1.50 | 0.5625 | −1.50 |
B | 1.50 | 0.00 | 0.5625 | 0.00 |
C | 1.50 | +1.50 | 0.5625 | +1.50 |
Figure 1 presents the item characteristic curves for the three items, and Figure 2 presents the corresponding item information functions. Although the three curves in Figure 1 share an identical slope at their respective midpoints, Figure 2 shows clearly that each item's information is concentrated in a different region of the trait continuum, directly illustrating the distinction drawn in Section 2.
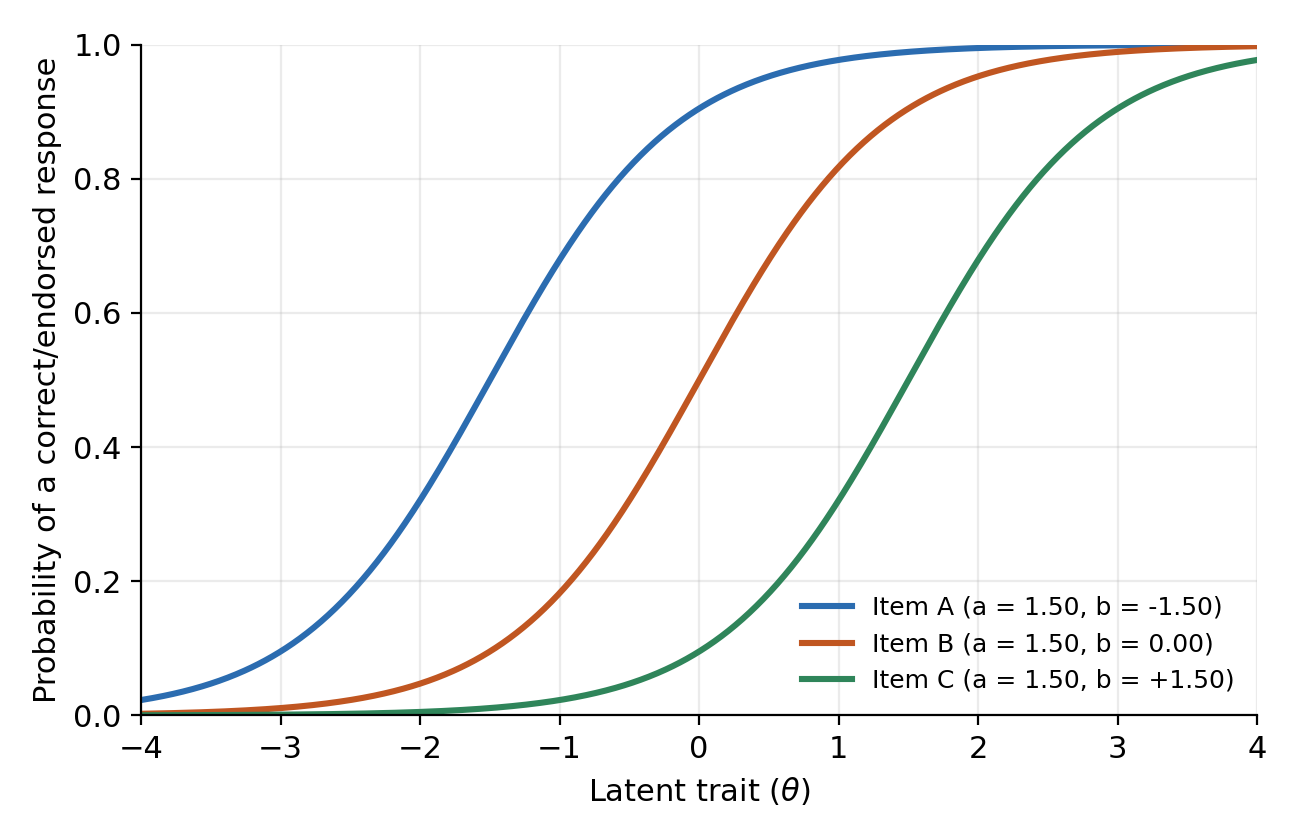
Figure 1. Item characteristic curves for three illustrative 2PL items sharing a common discrimination parameter (a = 1.50) but differing in location (b = −1.50, 0.00 and +1.50).
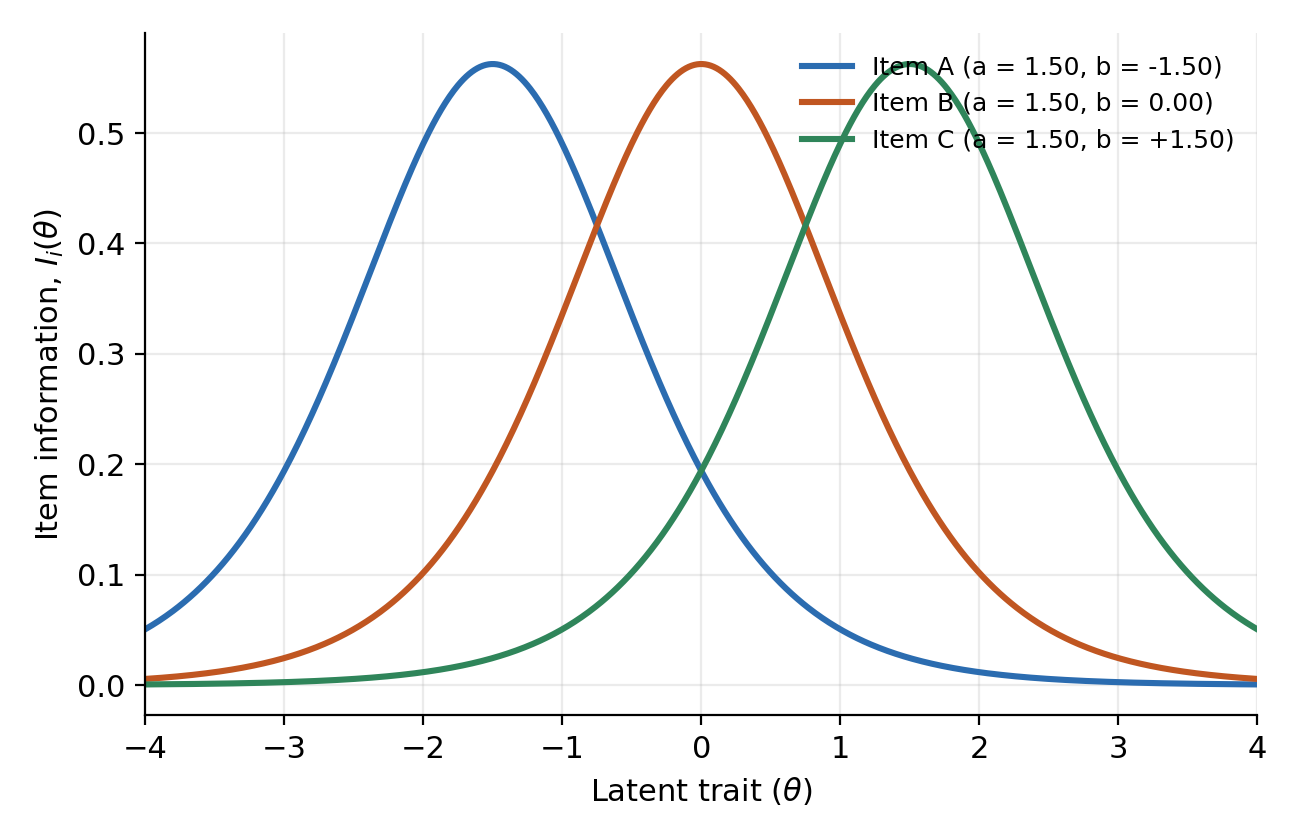
Figure 2. Item information functions for the same three items. Each curve peaks at θ = b for the corresponding item, with a maximum value of a²/4 = 0.5625.
Under local independence, the three item information functions sum to produce the test information function shown in Figure 3a, and the associated conditional standard error, obtained from Equation 5, is shown in Figure 3b. For this illustrative three-item test, aggregated information reaches a maximum of approximately 0.95 at θ = 0, corresponding to a standard error of approximately 1.03, and falls to approximately 0.22 at θ = ±3, corresponding to a standard error of approximately 2.13. The instrument therefore measures with reasonable, though still modest, precision near the centre of the distribution and with considerably less precision towards the extremes. These illustrative magnitudes reflect a deliberately minimal three-item test and should be interpreted as pedagogical; an operational instrument with a larger and more heterogeneous item pool would typically accumulate substantially more information at every point on the continuum.
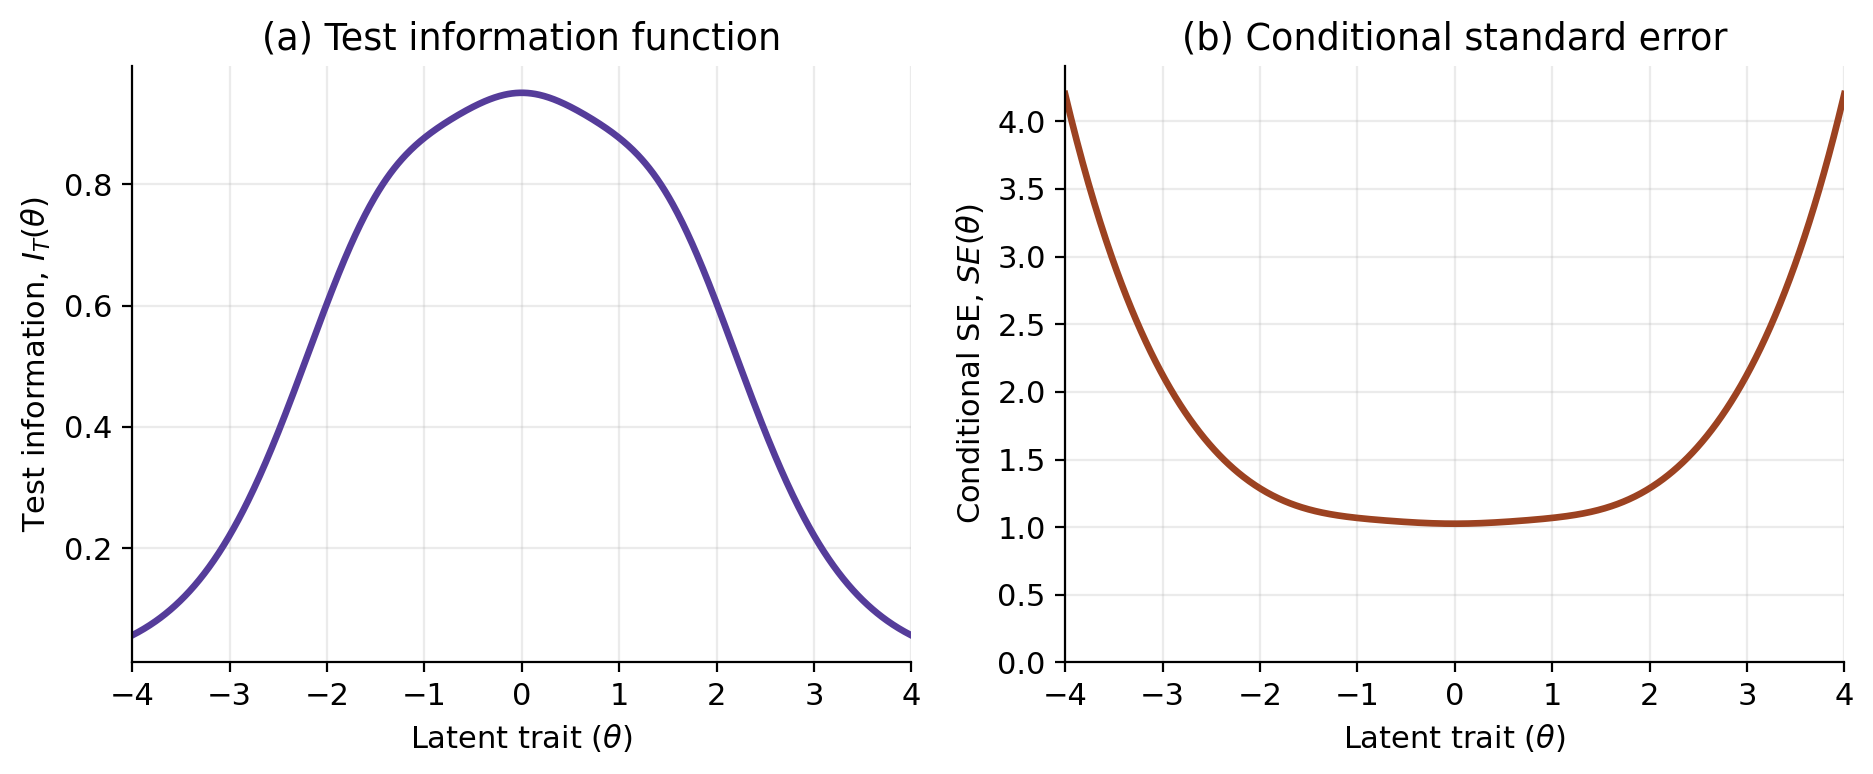
Figure 3. (a) Test information function and (b) conditional standard error for the three-item illustrative test formed by summing Items A, B and C.
Figure 4 illustrates the effect of introducing a non-zero lower asymptote, using an item with a = 1.50 and b = 0.00 estimated first under the 2PL model and then under the 3PL model with a guessing parameter of c = 0.20. Introducing guessing raises the lower portion of the item characteristic curve, and correspondingly reduces peak item information from 0.5625 under the 2PL model to approximately 0.38 under the 3PL model, with the peak also shifting slightly above θ = 0. This demonstrates concretely why the 2PL information formula in Equation 2 should not be applied to items estimated under a model that includes a non-zero lower or upper asymptote (Oladunmoye, 2026f;g;h;i).
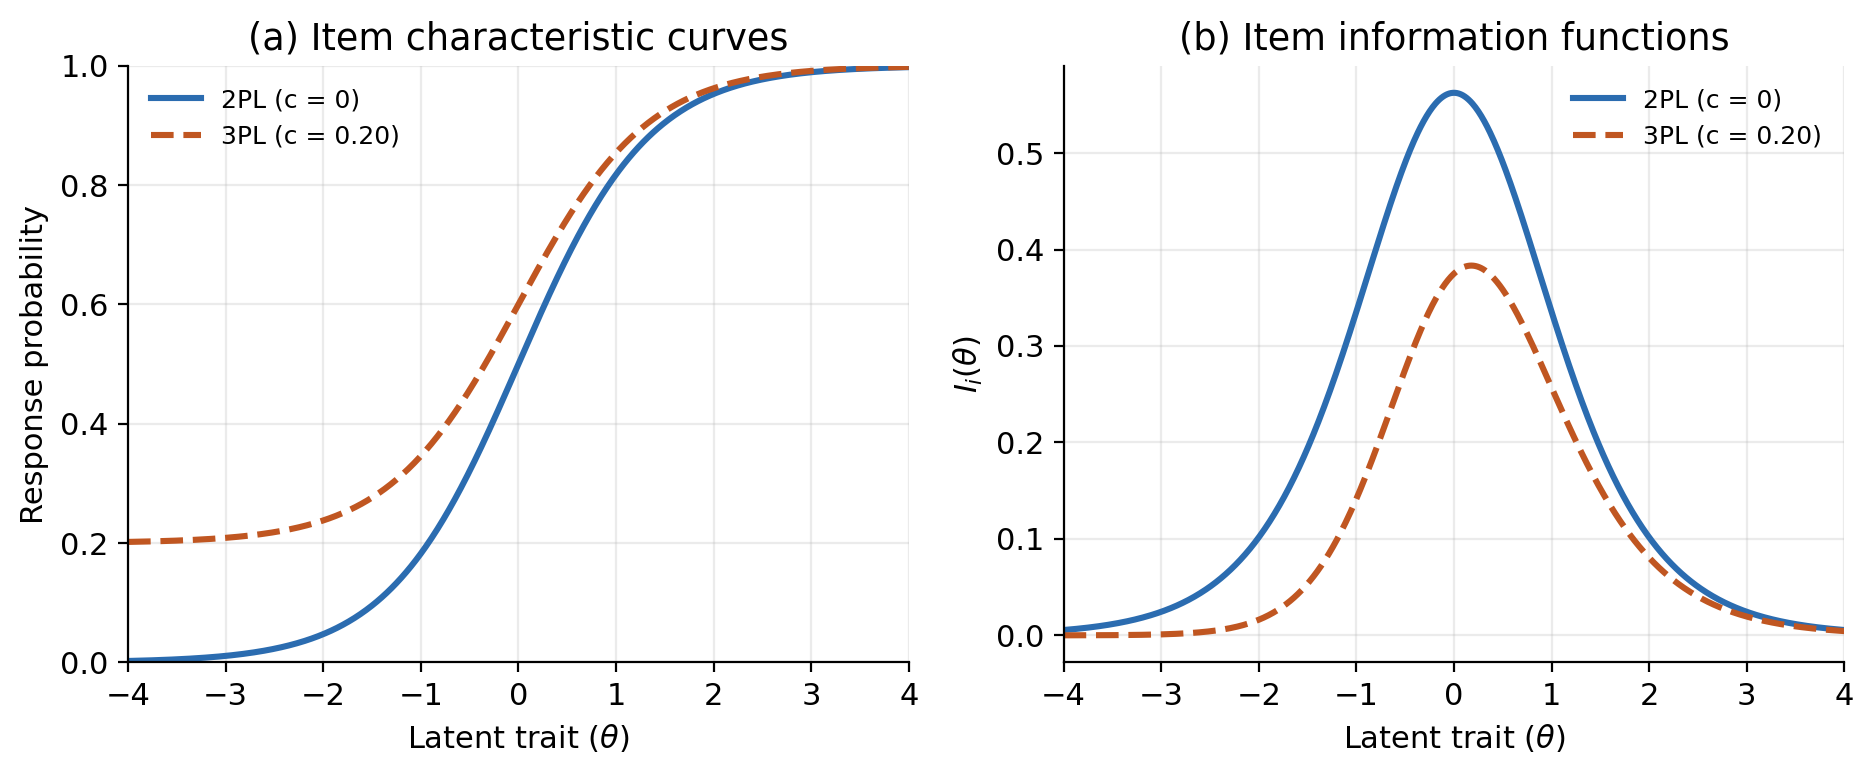
Figure 4. Effect of a non-zero lower asymptote (guessing parameter, c = 0.20) on (a) the item characteristic curve and (b) the item information function, relative to an otherwise identical 2PL item (a = 1.50, b = 0.00).
6. Applications of Item Information Functions
6.1 Scale development and item selection
During scale construction, item information functions allow researchers to establish whether a set of items collectively covers the desired range of the latent continuum. Table 2 presents a further illustrative set of three candidate items together with their peak information and their information at a target trait value of θ = 1.00, representing, for example, a clinically relevant threshold. Values in the final two columns were computed directly from Equation 2 rather than assigned arbitrarily.
Table 2. Illustrative item bank with peak information and information at a target trait level (θ = 1.00), computed from Equation 2.
Item | a | b | Peak information | θ at peak | Information at θ = 1.00 |
|---|---|---|---|---|---|
1 | 1.21 | −1.10 | 0.366 | −1.10 | 0.099 |
2 | 1.85 | 0.20 | 0.856 | 0.20 | 0.517 |
3 | 2.10 | 1.30 | 1.103 | 1.30 | 1.000 |
This kind of computation allows researchers to identify which items contribute most to precision at a specific point of substantive interest, an approach that is more principled than lengthening a scale simply because it appears too short, or retaining items solely because they load strongly on a common factor without reference to where their information is concentrated (Reise & Waller, 2003; Thissen & Wainer, 2001).
6.2 Short-form construction
Short-form development is particularly well suited to information-based decision making. Where a longer scale contains items with overlapping information, poorly targeted items, or clear gaps in coverage, an information-based selection procedure allows a reduced item set to preserve precision where it is most needed, rather than simply retaining the items with the highest factor loadings or discrimination values considered in isolation. Smith, McCarthy and Anderson (2000) documented a range of common pitfalls in short-form development, including the tendency for abbreviated scales to lose construct coverage and precision in ways that are not evident from internal consistency statistics alone; information-based selection directly addresses this concern by making the trade-off between test length and conditional precision explicit (Reise & Waller, 2003).
6.3 Computerised adaptive testing
Item information functions are foundational to computerised adaptive testing (CAT), in which items are selected sequentially to maximise information near the respondent's current trait estimate (Weiss, 1982; van der Linden & Pashley, 2010). Table 3 illustrates a simplified item-selection step for a hypothetical CAT algorithm with a current trait estimate of θ̂ = 1.40 and four candidate items sharing a discrimination of 1.40 but differing in location.
Table 3. Illustrative CAT item-selection step: information at the current trait estimate (θ̂ = 1.40) for four candidate items (a = 1.40), computed from Equation 2.
Item | b | Information at θ̂ = 1.40 |
|---|---|---|
A | −1.50 | 0.033 |
B | 0.00 | 0.212 |
C | 1.30 | 0.488 |
D | 2.80 | 0.212 |
Item C provides the greatest information at the current trait estimate and would ordinarily be selected next, assuming other CAT constraints are also satisfied. Information maximisation, however, is only one component of an operational CAT design. Item exposure control, content balancing, item security and test-length constraints must also be incorporated, because selecting purely on maximum information can lead to over-exposure of a small subset of highly discriminating items (van der Linden & Pashley, 2010).
6.4 Differential item functioning and measurement invariance
Item information functions can also supplement differential item functioning (DIF) analyses. Where two groups display similar item characteristic curves but different information functions, this may reflect underlying differences in discrimination or other item parameters across groups (Holland & Wainer, 1993). Comparing group-specific test information functions can indicate whether groups experience comparable measurement precision at particular trait levels, a consideration directly relevant to fairness in testing, which the Standards for Educational and Psychological Testing treat as inseparable from validity and reliability (AERA, APA, & NCME, 2014; Oladunmoye, Agbor, Olabisi, & Oyadeyi, 2024). This form of analysis supplements, rather than replaces, formal DIF detection procedures and measurement invariance testing.
7. Common Misconceptions and Recommended Practice
Applied use of item information functions is prone to a small number of recurring errors. Researchers should avoid the following practices.
- Treating information as an absolute, context-free indicator of item quality: information is conditional on θ and cannot be summarised meaningfully by a single number without reference to the trait level of interest.
- Assuming that the item with the highest discrimination parameter is always the best item: targeting, governed by item location, is equally important, as Section 3.1 demonstrates.
- Interpreting an information function without specifying the underlying IRT model: different models, including the one-, two-, three- and four-parameter logistic models and the various polytomous models, produce materially different information functions (Section 3).
- Ignoring local dependence when summing item information into a test information function: additivity assumes conditional independence, and violations can overstate the resulting test information function (Yen, 1993).
- Treating high information as sufficient evidence of validity: information concerns measurement precision, not the full evidential argument required to support a particular score interpretation and use (AERA, APA, & NCME, 2014; Oladunmoye, 2025).
- Neglecting content representativeness when optimising a scale purely for statistical information: doing so can produce an instrument that is statistically efficient but conceptually narrow relative to the construct it is intended to represent.
8. Reporting Recommendations
A transparent psychometric report drawing on IRT information should specify the model estimated, the estimation method, item parameters, item and test information functions, conditional standard errors, the trait range relevant to the intended use of the instrument, item-selection criteria where relevant, model-fit evidence and, where applicable, DIF or invariance evidence. An example reporting statement might read as follows.
Item information functions indicated that measurement precision varied across the latent trait continuum. Items with higher discrimination parameters generally contributed greater peak information, while item location determined the region in which that information was concentrated. The aggregated test information function indicated that the instrument provided its greatest precision in the central region of the trait continuum, with declining precision towards the extremes.
A statement of this kind communicates considerably more about an instrument's measurement properties than reporting a single reliability coefficient alone, and it allows a reader to judge directly whether the instrument is likely to be adequate for their particular population and purpose.
9. Software Implementation
Item and test information functions, together with conditional standard errors, can be estimated directly using established IRT software, including the mirt package for R, which implements a wide range of dichotomous and polytomous models (Chalmers, 2012), the ltm package for R (Rizopoulos, 2006), and the catR package for simulating and evaluating computerised adaptive test designs (Magis & Raîche, 2012). Embedding information-based diagnostics of this kind within an applied psychometric workflow, whether through general-purpose statistical software or a dedicated platform such as PsychtrixWeb, allows researchers to move beyond estimating item parameters and to evaluate directly where an instrument does, and does not, provide adequate measurement precision for its intended purpose.
10. Limitations
Standard interpretation of item information functions assumes that an appropriate unidimensional IRT model has been correctly specified for the data at hand. Where a scale is meaningfully multidimensional, a unidimensional information function may misrepresent measurement precision, and dimensionality should therefore be evaluated before an IRT model is fitted and its information functions interpreted (Embretson & Reise, 2000). Similarly, the additivity of item information across a test relies on the assumption of local independence, and violations of this assumption, arising for example from item chaining or shared stimulus material, can lead to an overstated test information function unless addressed directly (Yen, 1993; Oladunmoye, 2026a;b;c;d;e;f). Item information describes only one dimension of item and test quality. It does not substitute for evidence of content relevance, dimensionality, invariance or validity more broadly, and should be interpreted alongside these forms of evidence rather than in isolation.
11. Conclusion
The item information function offers one of the clearest illustrations of why item response theory is fundamentally a theory of conditional measurement precision. An item does not contribute the same amount of information at every point on the latent continuum; instead, Iᵢ(θ) changes systematically as θ changes, shaped jointly by an item's discrimination and its location. When individual item information functions are aggregated under local independence, they yield the test information function, which in turn determines the conditional standard error through Equation 5.
For applied researchers, this means that instrument evaluation should move beyond asking simply whether a scale is reliable, towards asking where along the latent continuum the scale measures with sufficient precision for the purpose for which it is intended to be used. This question is central to contemporary psychometric test development, scale refinement and adaptive testing, and it should be addressed explicitly, using item and test information functions, whenever an instrument is developed, shortened, adapted or evaluated for use with a new population (Oladunmoye, 2026i).
References
- American Educational Research Association, American Psychological Association, & National Council on Measurement in Education. (2014). Standards for educational and psychological testing. American Educational Research Association.
- Baker, F. B. (2001). The basics of item response theory (2nd ed.). ERIC Clearinghouse on Assessment and Evaluation.
- Baker, F. B., & Kim, S. H. (2004). Item response theory: Parameter estimation techniques (2nd ed.). Marcel Dekker.
- Birnbaum, A. (1968). Some latent trait models and their use in inferring an examinee's ability. In F. M. Lord & M. R. Novick, Statistical theories of mental test scores (pp. 397 to 479). Addison Wesley.
- Chalmers, R. P. (2012). mirt: A multidimensional item response theory package for the R environment. Journal of Statistical Software, 48(6), 1 to 29.
- De Ayala, R. J. (2009). The theory and practice of item response theory. Guilford Press.
- Embretson, S. E., & Reise, S. P. (2000). Item response theory for psychologists. Lawrence Erlbaum Associates.
- Hambleton, R. K., Swaminathan, H., & Rogers, H. J. (1991). Fundamentals of item response theory. Sage.
- Holland, P. W., & Wainer, H. (Eds.). (1993). Differential item functioning. Lawrence Erlbaum Associates.
- Loken, E., & Rulison, K. L. (2010). Estimation of a four parameter item response theory model. British Journal of Mathematical and Statistical Psychology, 63(3), 509 to 525.
- Lord, F. M. (1980). Applications of item response theory to practical testing problems. Lawrence Erlbaum Associates.
- Magis, D., & Raîche, G. (2012). Random generation of response patterns under computerized adaptive testing with the R package catR. Journal of Statistical Software, 48(8), 1 to 31.
- Masters, G. N. (1982). A Rasch model for partial credit scoring. Psychometrika, 47(2), 149 to 174.
- Muraki, E. (1992). A generalized partial credit model: Application of an EM algorithm. Applied Psychological Measurement, 16(2), 159 to 176.
- Oladunmoye E.O (2025). Ultra-short scales in employee assessment: balancing efficiency and accuracy. Journal of Applied Sciences, Information and Computing.6(2),103-108.
- Oladunmoye, E. O. (2026a). Validity in Psychological Assessment: Evidence, Interpretation, and Common Misconceptions. PsychtrixWeb Research Note, 005. Psychtrix Initiative Limited. https://www.psychtrixweb.online/research-notes/005-1-introduction.
- Oladunmoye, E. O. (2026b). Reliability in Psychological Measurement. PsychtrixWeb Research Note, 004. Psychtrix Initiative Limited. https://www.psychtrixweb.online/research-notes/004abstract-2
- Oladunmoye, E. O. (2026c). Cronbach's Alpha versus McDonald's Omega. PsychtrixWeb Research Note, 008. Psychtrix Initiative Limited. https://www.psychtrixweb.online/research-notes/008abstract-4
- Oladunmoye, E. O. (2026d). Exploratory Factor Analysis Versus Confirmatory Factor Analysis. PsychtrixWeb Research Note, 007. Psychtrix Initiative Limited. https://www.psychtrixweb.online/research-notes/007-abstract-3
- Oladunmoye, E. O. (2026e). From Questionnaire to Validated Instrument: A Complete Psychometric Analysis Workflow Using PsychtrixWeb. PsychtrixWeb Research Note, 006. Psychtrix Initiative Limited. https://www.psychtrixweb.online/research-notes/006-1-introduction-2
- Oladunmoye, E. O. (2026f). Item response theory: From observed responses to latent trait measurement. PsychtrixWeb Research Notes, 011.
- Oladunmoye, E. O. (2026g). The Rasch model and 1PL IRT: Understanding item difficulty, person ability, and invariant measurement. PsychtrixWeb Research Notes, 012.
- Oladunmoye, E. O. (2026h). The two-parameter logistic IRT model: Understanding item discrimination, difficulty, and differential item functioning. PsychtrixWeb Research Notes, 013.
- Oladunmoye, E. O. (2026i). Validity in psychological measurement: Beyond reliability and statistical significance. PsychtrixWeb Research Notes, 003.
- Oladunmoye, E. O., Muhammad T. S., (2024). Development and Validation of Multiple Intelligence Test among emerging adults in the United Kingdom. ISAR Journal of Arts, Humanities and Social Sciences, 2(4), 18-24.
- Oladunmoye, E.O., Agbor, E.C., Olabisi, O.L., and Oyadeyi, J.B., (2024). Estimating measurement invariance on emotional intelligence scale across gender and age among undergraduates in Nigeria. Thinking Skills and Creativity Journal. 7(1),50-60
- Oladunmoye, E.O., Enamudu, G.P., Sa'ad, M.T. (2024). A Differential Item Functioning estimate of WAEC Mathematics test form based on gender and age among secondary school students. ISAR Journal of Multidisciplinary Research and Studies, 2(5), 15-21.
- Ostini, R., & Nering, M. L. (2006). Polytomous item response theory models. Sage.
- Rasch, G. (1960). Probabilistic models for some intelligence and attainment tests. Danish Institute for Educational Research.
- Reise, S. P., & Waller, N. G. (2003). Item response theory and clinical measurement. Annual Review of Clinical Psychology, 5, 27 to 48.
- Rizopoulos, D. (2006). ltm: An R package for latent variable modelling and item response theory analyses. Journal of Statistical Software, 17(5), 1 to 25.
- Samejima, F. (1969). Estimation of latent ability using a response pattern of graded scores. Psychometrika Monograph, No. 17.
- Smith, G. T., McCarthy, D. M., & Anderson, K. G. (2000). On the sins of short form development. Psychological Assessment, 12(1), 102 to 111.
- Thissen, D., & Wainer, H. (Eds.). (2001). Test scoring. Lawrence Erlbaum Associates.
- van der Linden, W. J., & Pashley, P. J. (2010). Item selection and ability estimation in adaptive testing. In W. J. van der Linden & C. A. W. Glas (Eds.), Elements of adaptive testing (pp. 3 to 30). Springer.
- Weiss, D. J. (1982). Improving measurement quality and efficiency with adaptive testing. Applied Psychological Measurement, 6(4), 473 to 485.
- Yen, W. M. (1993). Scaling performance assessments: Strategies for managing local item dependence. Journal of Educational Measurement, 30(3), 187 to 213.
Suggested citation
Oladunmoye, E. O. (2026). Item Information Functions in Item Response Theory: A Conceptual and Methodological Review of Measurement Precision. PsychtrixWeb Research Note, 017. Psychtrix Initiative Limited. https://doi.org/10.5281/zenodo.23087965Discuss this Research Note
Scholarly comments are welcome from anyone — no account required. Contributions are moderated before they appear.
No comments yet. Start the scholarly discussion below.