
The Rasch Model and 1PL Item Response Theory: Item Difficulty, Person Ability, and Invariant Measurement
Abstract
The Rasch model occupies a distinctive position in modern psychometric theory. Although it is frequently described as a one parameter logistic (1PL) Item Response Theory (IRT) model, treating the two as fully interchangeable obscures an important conceptual distinction. Both frameworks employ a logistic function relating the probability of a response to the difference between a person's location and an item's location on a latent continuum, and under common parameterisations the equations are mathematically equivalent. Rasch measurement, however, is distinguished by a stronger theoretical commitment: invariant comparison, specific objectivity, unidimensional measurement, and the requirement that observed data demonstrate adequate conformity to the model rather than the model being adjusted to fit the data.
1. Introduction
Research Note 011 introduced Item Response Theory as a general framework for understanding how individual items function across a latent trait continuum. That note established the vocabulary of latent traits, item characteristic curves, item difficulty and discrimination, guessing parameters, item and test information, theta estimation, Differential Item Functioning, item banking, and Computerised Adaptive Testing (CAT).
The present note moves from that general framework to one of its most influential special cases: the Rasch model. The model was developed by the Danish mathematician and psychometrician Georg Rasch (Rasch, 1960) and is fundamentally concerned with constructing measures from probabilistic observations rather than merely describing patterns of association among items. It was originally formulated for dichotomous responses, although Wright and Masters (1982) subsequently extended the Rasch measurement framework to ordered-category responses, including rating scales, attitude questionnaires, and performance ratings.
What distinguishes the Rasch model from a purely descriptive statistical exercise is that it does not simply ask whether an item correlates with a total score. Instead, it proposes a measurement relationship between a person's location on a latent variable and an item's location on that same variable, and it treats the adequacy of that relationship as something to be tested against data rather than assumed. The central idea is elegantly simple: the probability of a positive response depends only on the difference between the person's location and the item's location on the latent continuum (Oladunmoye, Agbor, Olabisi, & Oyadeyi, 2024).
2. Connecting Research Note 011 to Research Note 012
Research Note 011 established the general IRT framework and introduced a wide vocabulary that is presupposed throughout the present note, including:
- latent traits and their operationalisation in psychological measurement;
- item characteristic curves as a description of item behaviour across the trait continuum;
- item difficulty (location) and discrimination as the parameters governing those curves;
- pseudo-guessing parameters in models that require them;
- item and test information functions and their relationship to measurement precision;
- theta estimation procedures;
- Differential Item Functioning (DIF), item banking, and Computerised Adaptive Testing (CAT) (Oladunmoye, 2026a).
3. What Is the Rasch Model?
For dichotomous responses (for example, correct/incorrect, endorsed/not endorsed, agree/disagree), the Rasch model expresses the probability that person p provides a positive response to item i as a logistic function of the difference between the person's location and the item's location:
P(Xpi = 1) = exp(θp − bi) / [1 + exp(θp − bi)]
logit[P(Xpi = 1)] = θp − bi
4. Person Ability Versus Item Difficulty
The intuition behind the model is best conveyed through worked examples. Suppose a person's location is θ = 2.0 and an item's location is b = 1.0. The difference is θ − b = 1.0, meaning the person is located one logit above the item. Substituting into the model shows that the probability of a positive response is approximately 0.73, comfortably above the midpoint of 0.50. Conversely, if θ = 0.0 and b = 2.0, the difference is − 2.0: the person is located substantially below the item, and the probability of a positive response falls to approximately 0.12.
θ − b (logits) | P(positive response) | Interpretation |
|---|---|---|
-3.0 | 0.047 | Person far below item location |
-2.0 | 0.119 | Person substantially below item |
-1.0 | 0.269 | Person moderately below item |
0.0 | 0.500 | Person and item at the same location |
1.0 | 0.731 | Person moderately above item |
2.0 | 0.881 | Person substantially above item |
3.0 | 0.953 | Person far above item location |
Table 1. Probability of a positive response as a function of the difference between person location and item location (θ − b).
5. The Meaning of the Logit
Rasch measurement conventionally expresses both item and person locations in logits. A logit is the natural logarithm of the odds of a positive response:
logit(P) = ln[P / (1 − P)]
6. Why a Common Scale Matters
Consider two respondents completing the same twenty-five item test. Respondent A answers fifteen relatively easy items correctly. Respondent B answers fifteen relatively difficult items correctly. Under conventional raw-score scoring, the two respondents receive an identical observed score of fifteen. Yet the measurement context in which that score was obtained differs substantially.
7. The Rasch Model and Invariance
One of the most important concepts associated with Rasch measurement is invariance. The theoretical goal is that comparisons among items should not depend fundamentally on which appropriate persons were used for calibration, and that comparisons among persons should not depend fundamentally on which appropriate items were administered.
8. Rasch Invariance Is Not the Same as Measurement Invariance in Confirmatory Factor Analysis
This distinction is crucial and is frequently blurred in applied psychometric writing. In conventional structural equation modelling, measurement invariance commonly refers to testing whether the factor loadings, intercepts, and residual variances of a measurement model operate comparably across groups, typically through a sequence of increasingly constrained multi-group confirmatory factor models (Oladunmoye, Enamudu, & Sa'ad, 2024).
9. Rasch Measurement and ‘Specific Objectivity’
A distinctive concept in Rasch measurement is specific objectivity. The basic idea is that comparisons between persons should be separable from the particular subset of items used to make them, provided the data conform adequately to the model, and that comparisons between items should likewise be separable from the particular sample of persons used for calibration.
10. Rasch Versus Generic 1PL IRT
The terms Rasch model and one-parameter logistic (1PL) model are frequently used interchangeably in applied literature, and mathematically there is indeed substantial overlap between them. Conceptually, however, the distinction matters for how the model is understood and applied.
Generic 1PL IRT
A generic 1PL IRT model typically emphasises bi as an item location parameter while treating discrimination as fixed and equal across items, largely as a matter of statistical convenience or parsimony rather than as a substantive measurement commitment.
Rasch Measurement
Rasch measurement places much stronger emphasis on a cluster of related commitments: invariant measurement, specific objectivity, explicit model requirements that the data must satisfy, item-person separation, unidimensionality, and the goal of empirical fit to a pre-specified model rather than the selection of whichever model fits best after the fact.
11. Why the Equal-Discrimination Assumption Matters
In a two-parameter logistic (2PL) model, each item is permitted its own discrimination parameter, ai. In the Rasch model, by contrast, discrimination is constrained to be equal across all items, so that a1 = a2 = ⋯ = an. This is a strong assumption, and its consequences deserve careful attention.
12. Rasch Is Not Automatically the Best Model
A common mistake in applied psychometric practice is to reason that because the Rasch model is often described as a gold standard for measurement, every scale should therefore be fitted with a Rasch model. That conclusion does not follow, and asserting it uncritically risks doing more harm than good to an instrument's development.
13. Rasch and Unidimensionality
A Rasch measure is intended to represent a single, dominant latent variable. The researcher must therefore investigate whether the item set can reasonably be understood as measuring one dominant construct before proceeding to Rasch calibration; this connects directly to the dimensionality-assessment procedures described elsewhere in the PsychtrixWeb Research Notes series.
14. Local Independence
The Rasch model also assumes local independence: conditional on the latent trait, responses to different items are statistically independent of one another. Formally, once a person's location on θ has been accounted for, the response to item i and the response to item j should show no substantial remaining association.
15. Rasch Item Difficulty
The item parameter bi indicates where an item is located on the latent continuum. If bi = −2.0, the item is located relatively low on the trait, meaning it is easy to endorse or easy to answer correctly; if bi = +2.0, the item is located relatively high, meaning it requires a substantially higher level of the trait before endorsement becomes likely.
16. Person Location
The corresponding person parameter θp represents the person's own location on the latent variable. Thus θp > bi indicates that the person is located above a given item's location, while θp < bi indicates that the person is located below it. The difference θp − bi, as established in Section 3, is precisely what determines the probability of a positive response to that item, and this relationship underlies every diagnostic and descriptive statistic discussed in the remainder of this note.
17. The Person-Item Map
One of the most practically useful visualisations in Rasch analysis is the person-item map, sometimes called a Wright map after Benjamin Wright, who did much to popularise its use in applied Rasch work. The map places persons and items on the same latent continuum, typically with persons displayed on one side, often as a distribution of dots or a histogram, and items displayed on the other side, usually as discrete points or short labels corresponding to individual items.
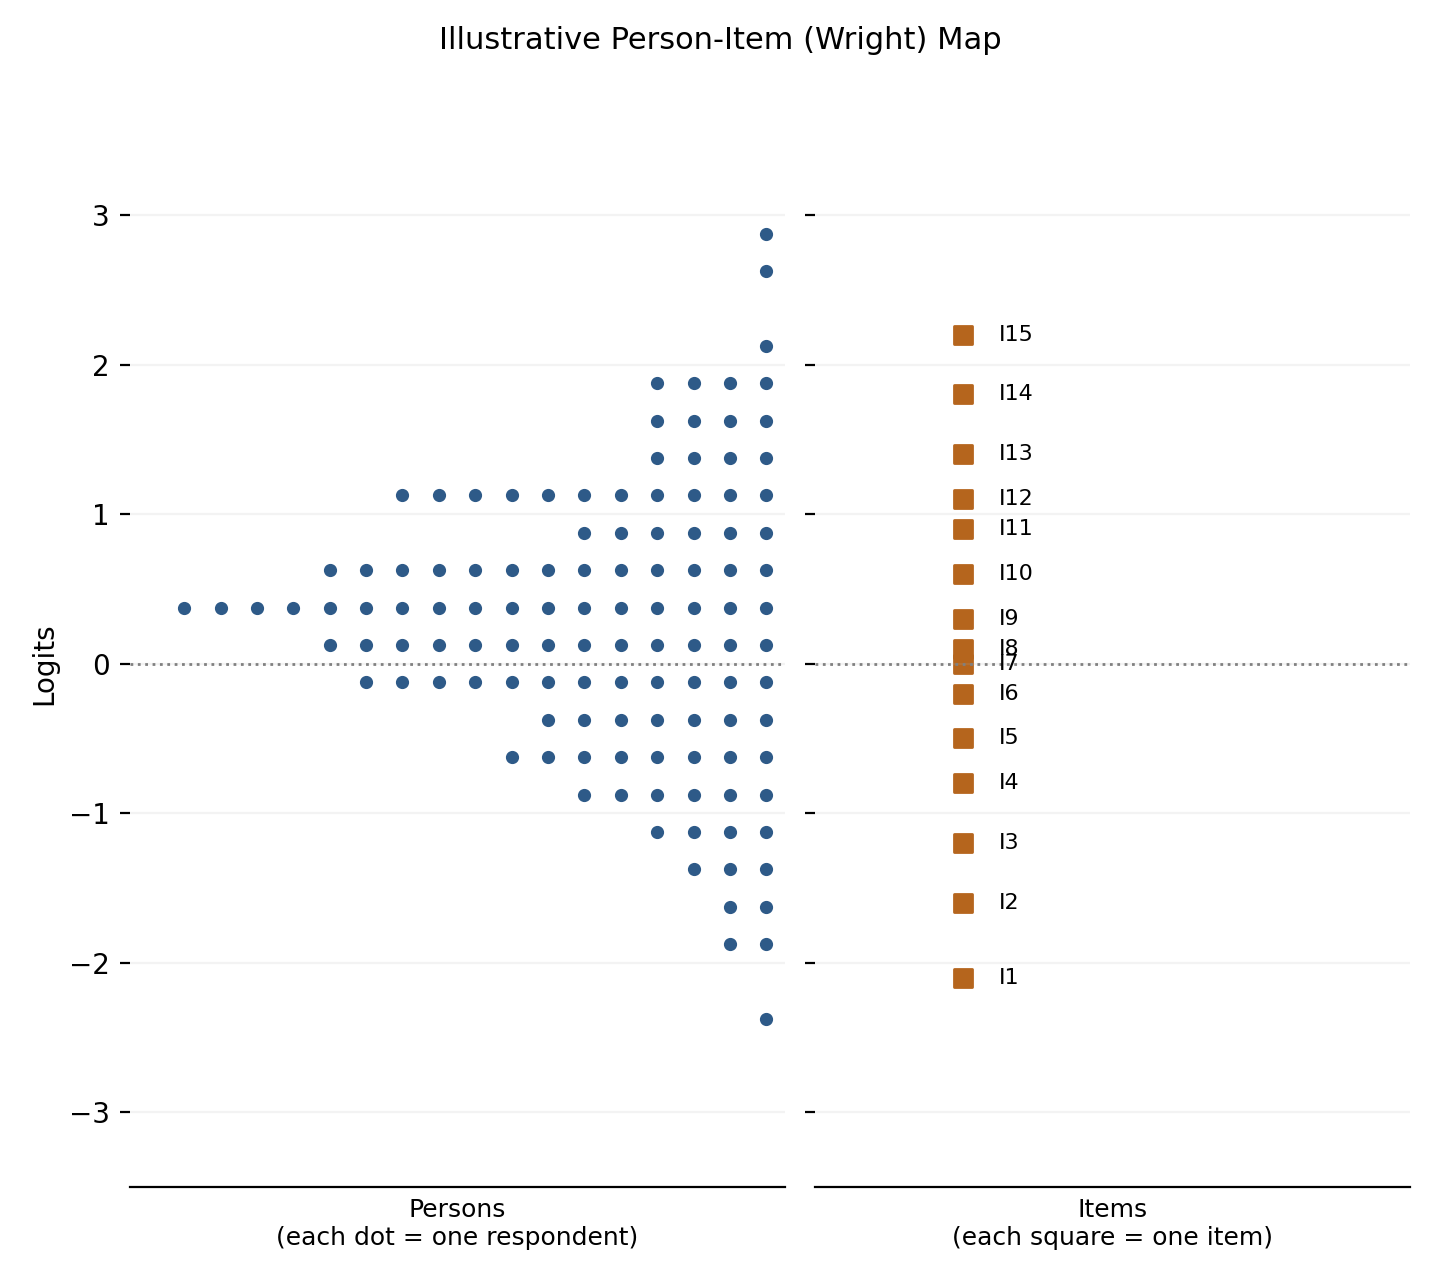
Figure 1. An illustrative person-item map showing the distribution of 120 simulated respondents (left) against the calibrated locations of 15 items (right), both expressed on a shared logit scale.
18. Why the Person-Item Map Is Important for Scale Development
Imagine that a resilience scale comprises thirty items whose calibrated locations cluster narrowly between −0.5 and +0.5 logits, while the great majority of respondents are located between −2.0 and +2.0 logits. The scale in this scenario would provide comparatively weak measurement coverage at the extremes of the resilience continuum, precisely where clinicians or researchers may most wish to distinguish among respondents, for example to identify those at greatest risk or those showing the most robust resilience (Oladunmoye, 2025).
19. Item Fit
Rasch analysis examines whether observed response patterns are sufficiently consistent with the response patterns that the model would predict given the estimated person and item locations. Fit statistics compare observed response behaviour against these model-based expectations, and substantial discrepancies between the two warrant further investigation rather than being ignored or, at the other extreme, treated as automatic grounds for discarding an item.
20. Infit
Infit is commonly described as a weighted, information-sensitive mean-square fit statistic. It is particularly sensitive to responses that are unexpected for persons whose locations are relatively close to a given item's location, that is, to the responses that carry the most information under the model.
21. Outfit
Outfit is an unweighted mean-square fit statistic and, unlike infit, is not weighted by information. It is correspondingly more sensitive to unusual responses that occur relatively far from the expected item-person location, that is, to unexpected responses on items that are either much easier or much harder than a given person's own location would predict.
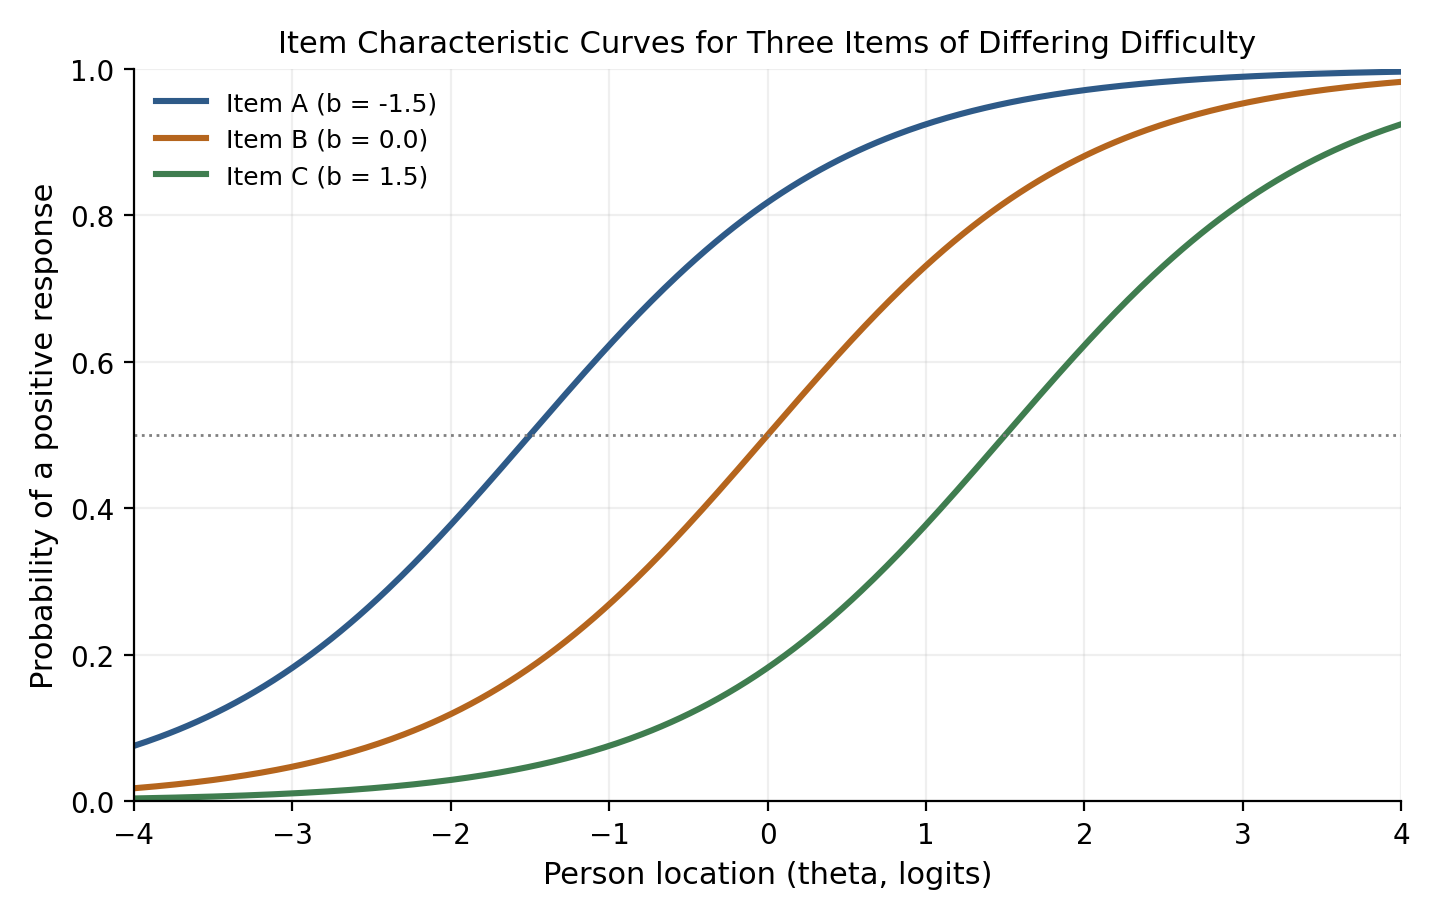
Figure 2. Item characteristic curves for three items of differing difficulty (b = -1.5, 0.0, and +1.5 logits) under the dichotomous Rasch model. Fit statistics evaluate how closely observed response patterns track curves of this shape.
22. Do Not Delete Items Solely Because of Fit Statistics
An item that shows poor fit should trigger investigation, not automatic removal. A wide range of substantive explanations may underlie a misfitting item, including multidimensionality not adequately screened out beforehand, ambiguous item wording, local dependence with other items, atypical response processes, reverse-scoring problems, subgroup-specific effects, or straightforward data quality issues.
23. Person Fit
Rasch analysis can also examine unusual person response patterns through person-fit statistics, which are the mirror image of the item-fit statistics discussed above. A respondent may, for example, show extremely inconsistent responses across items of differing difficulty, improbable reversals in which easy items are missed while much harder items are endorsed, other suspicious or idiosyncratic response patterns, or signs of inattentive or careless responding throughout a survey.
24. Person Separation
Rasch analysis routinely reports a person separation index. Conceptually, separation indicates how well an instrument distinguishes respondents across different levels of the latent trait, relative to the amount of measurement error present. A simplified relationship expresses separation as the square root of the ratio of true variance to error variance:
Separation = √(true variance / error variance)
25. Person Reliability
Rasch analysis can also provide a reliability index that is directly related to person separation. Conceptually, this reliability index is expressed as the ratio of true variance to observed variance:
Reliability = true variance / observed variance
26. Item Separation
The same underlying logic can be applied to items rather than persons. Item separation indicates how well the calibration sample provides enough information to distinguish items across the latent continuum. If item separation is low, the calibration sample may not adequately distinguish the relative locations of the items from one another, which in turn undermines confidence in the ordering of item difficulties reported by the analysis.
27. Rasch and Likert Scales
Rasch measurement is not restricted to right/wrong or endorse/do-not-endorse tests. Wright and Masters (1982) developed rating-scale analysis specifically for ordered-category data, including attitude questionnaires, symptom checklists, and performance ratings, extending the basic logic of the dichotomous model described in Section 3 to items with more than two ordered response categories.
28. Category Functioning
For a Likert-type item, response categories should ideally demonstrate a meaningful and orderly progression, so that each successive category (1 → 2 → 3 → 4 → 5) is more probable than its neighbours across a distinct, non-overlapping region of the latent trait. Figure 3 illustrates this well-ordered pattern for a hypothetical five-category item, using threshold locations of −2.0, −0.7, +0.6, and +2.0 logits.
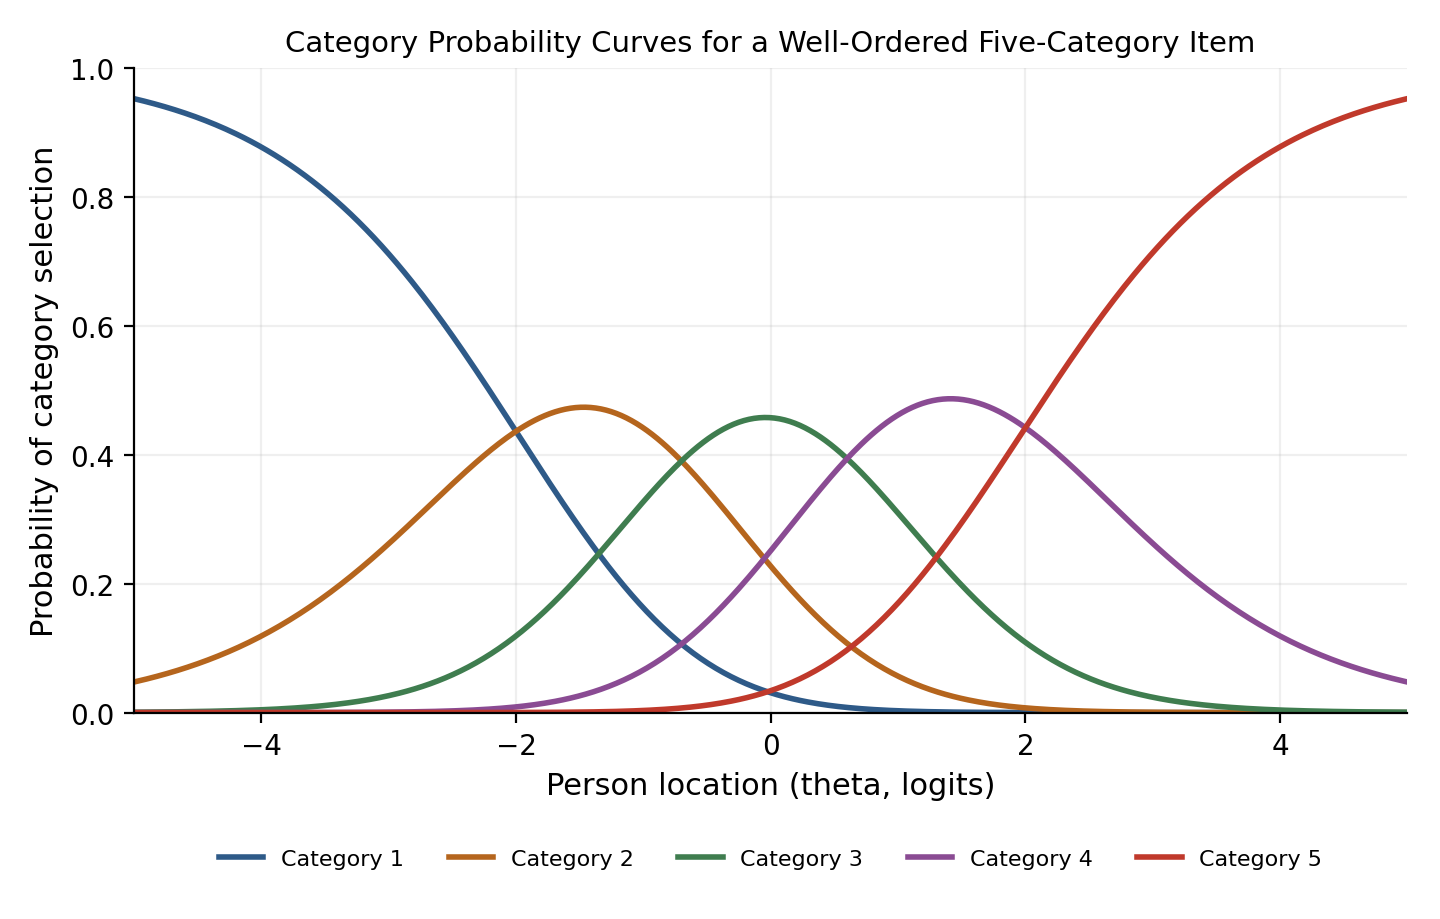
Figure 3. Category probability curves for a well-ordered five-category item. Each curve is the most likely response option across a distinct, non-overlapping region of the trait continuum.
29. Disordered Thresholds
Suppose a five-point item produces estimated thresholds of τ1 = −1.8, τ2 = −0.7, τ3 = −0.9, and τ4 = +1.4. The ordering −1.8 < −0.7 > −0.9 < +1.4 is problematic, because τ3 falls below τ2 rather than above it, meaning the third threshold is out of sequence with the second.
30. Rasch and Psychological Scale Development
Consider a thirty-five item psychological wellbeing scale under development. A conventional workflow for such a scale might proceed from the initial item pool through exploratory factor analysis, then confirmatory factor analysis, and finally to the computation of alpha or omega as a summary reliability statistic.
31. Rasch and Differential Item Functioning
Differential Item Functioning was introduced in an earlier PsychtrixWeb Research Note. Rasch analysis provides a natural environment for investigating whether a given item behaves differently across groups, because the model already places persons and items on a shared continuum against which such comparisons can be made directly.
32. Rasch and Fairness
This property makes Rasch analysis potentially useful for investigating fairness across a range of comparisons, including gender, age-group, cultural group, educational group, geographic population, and language group comparisons, among others.
33. Rasch and Cross-Cultural Assessment
The issue of fairness becomes particularly pressing when psychological instruments developed in one cultural setting are subsequently used, often after translation, in a substantially different setting. Suppose, for example, that a resilience item was originally developed in a European context and later translated for use with respondents in Uganda.
34. Rasch and African Psychological Measurement
The Rasch framework has particular potential for psychological measurement in African contexts, where researchers frequently encounter adapted instruments developed elsewhere, translations whose cross-cultural equivalence has not always been rigorously established, heterogeneous populations spanning wide ranges of language and education, and limited normative data against which to benchmark new samples (Oladunmoye, 2026e).
35. Rasch Analysis in PsychtrixWeb
A robust PsychtrixWeb Rasch module should be organised as a sequence of eleven distinct steps, each producing evidence that feeds into the steps that follow rather than being treated as an isolated procedure.
- Data import: accept CSV, XLSX, or other compatible data formats.
- Variable definition: identify the person identifier, item variables, reverse-scored items, missing-value codes, and any grouping variables needed for later DIF analysis.
- Response-format detection: determine whether the items are dichotomous, ordinal, or otherwise polytomous.
- Dimensionality assessment: evaluate whether a single Rasch dimension is defensible for the item set as a whole.
- Model selection: choose the dichotomous Rasch model, the rating scale model, the partial credit model, or another appropriate member of the Rasch family, depending on the response format and prior dimensionality evidence.
- Calibration: estimate item and person locations under the selected model.
- Fit analysis: compute infit, outfit, standardised fit statistics, and relevant residual diagnostics for both items and persons.
- Person-item map: display persons and items together on a shared logit scale.
- Category analysis: for ordinal items, examine category frequencies, threshold ordering, and category-level fit.
- DIF: compare item functioning across relevant demographic or clinical groups.
- Reporting: generate a publication-ready psychometric report summarising all of the preceding evidence in accessible language (Oladunmoye, 2026d; Oladunmoye, 2026e).
36. Proposed PsychtrixWeb Rasch Dashboard
Table 2 illustrates the kind of summary dashboard that a researcher using PsychtrixWeb could expect to receive at the conclusion of a Rasch analysis. The figures shown are illustrative rather than the results of any actual empirical analysis, and are included purely to demonstrate the intended format and level of detail of the dashboard output.
Component | Example output |
|---|---|
Model | Rasch (dichotomous) |
Persons | 842 |
Items | 24 |
Mean person location | 0.42 logits |
Mean item location | 0.00 logits |
Person separation | 2.31 |
Person reliability | .84 |
Item separation | 4.12 |
Item reliability | .94 |
Infit range | 0.82-1.24 |
Outfit range | 0.76-1.38 |
DIF | 3 flagged items |
Category problems | 1 item |
Coverage | Moderate gap at high trait levels |
Table 2. An illustrative PsychtrixWeb Rasch dashboard summary. All numerical values are illustrative and do not represent empirical findings.
37. Automated Rasch Interpretation
PsychtrixWeb should not merely generate statistics; it should translate those statistics into cautious, methodologically appropriate language that guides the researcher towards further investigation rather than towards premature conclusions.
38. A Rasch Decision Engine
Figure 4 sets out a proposed staged workflow through which a Rasch decision engine within PsychtrixWeb might guide a researcher from an initial dimensionality check through to a final measurement decision, branching at each stage according to whether the available evidence is judged adequate or problematic.
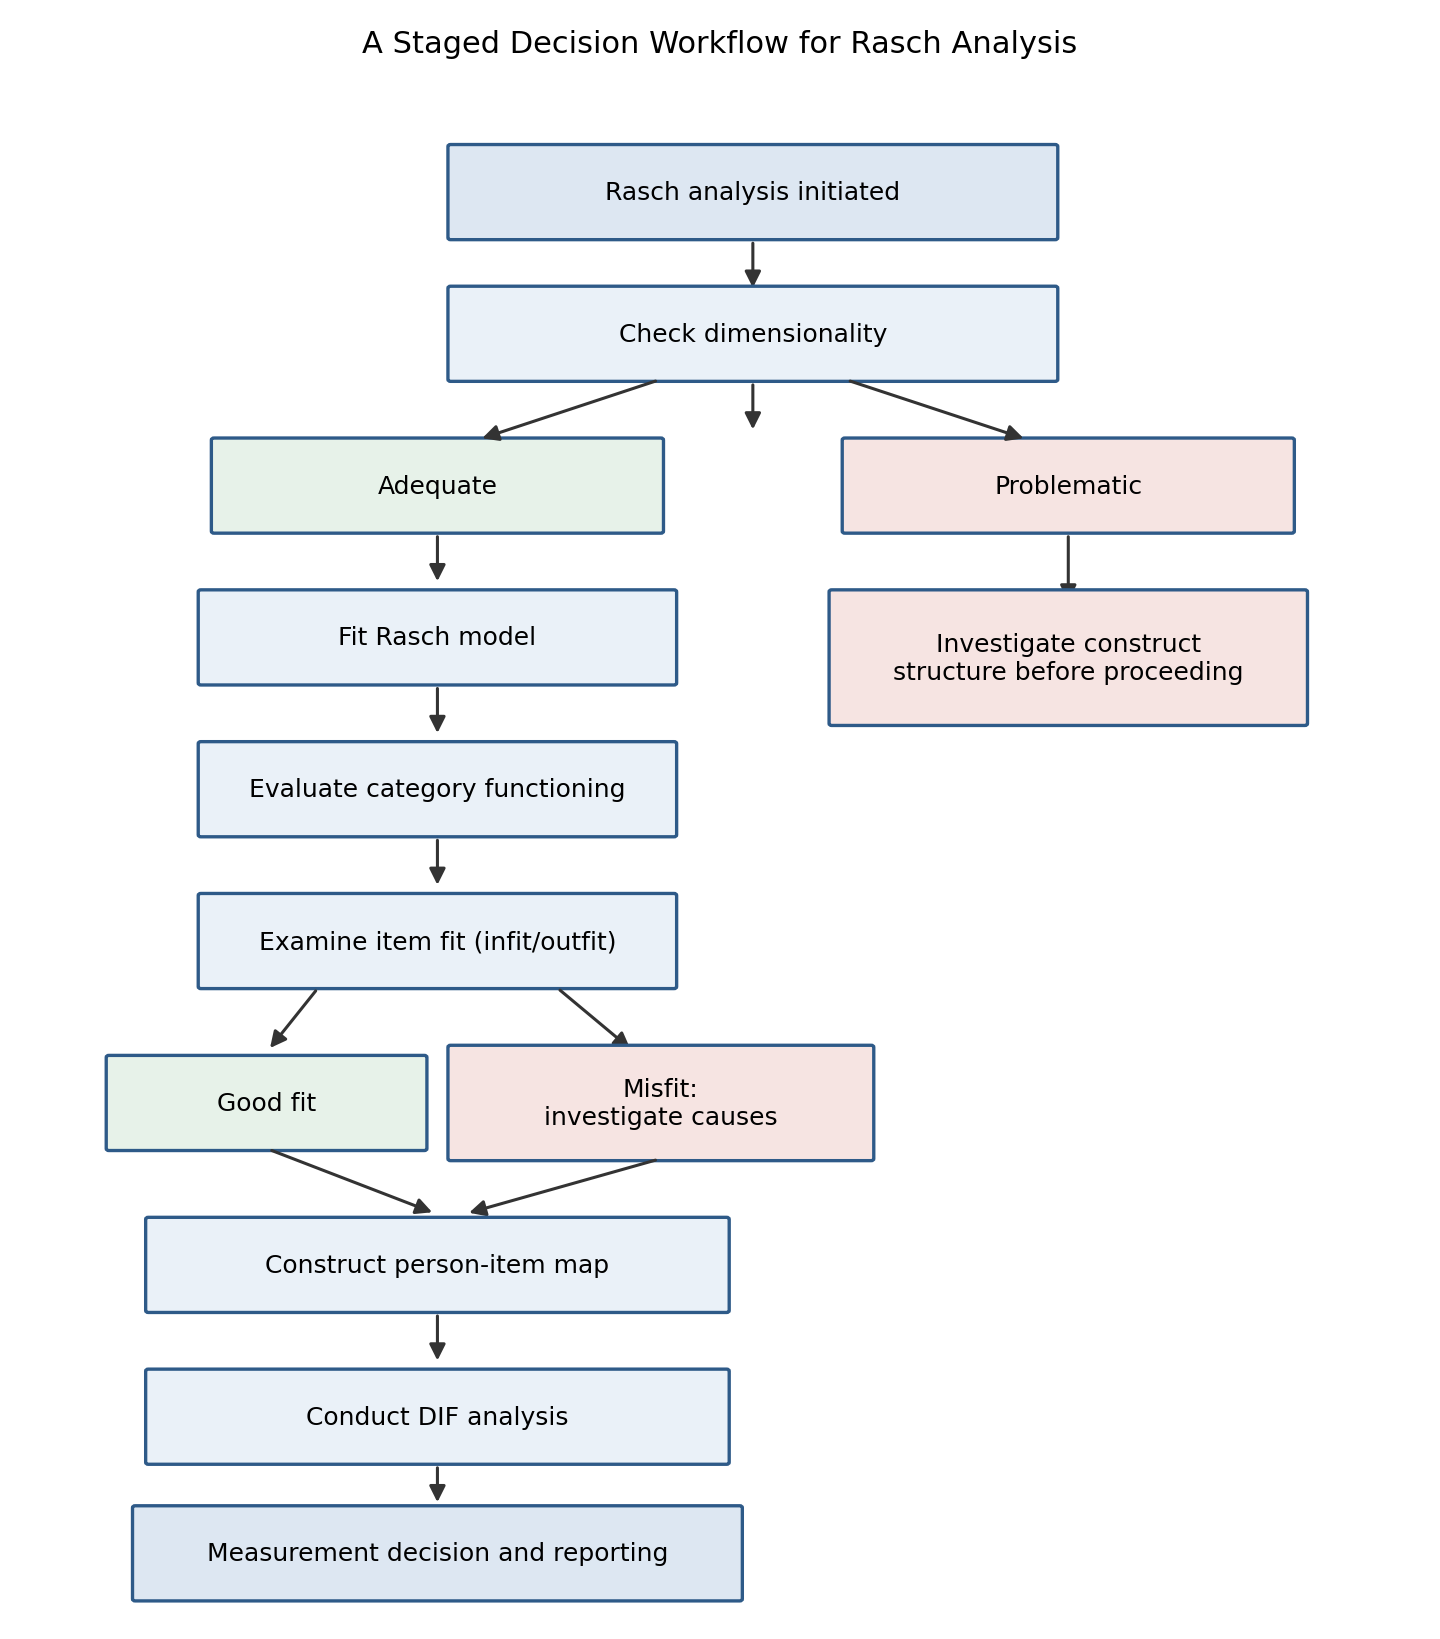
Figure 4. A staged decision workflow for Rasch analysis within PsychtrixWeb, from an initial dimensionality check through to a final measurement decision and report.
39. What a Rasch Report Should Not Do
A responsible Rasch report should not automatically assert that an instrument is valid simply because it fits the Rasch model, nor that an instrument is reliable simply because person reliability happens to equal .90, nor that a scale is unbiased simply because no DIF was detected in a particular analysis. Statements of this kind overreach the evidence that a Rasch analysis can actually provide.
40. Rasch Versus Classical Test Theory
Rasch measurement and Classical Test Theory can provide complementary rather than competing information about the same instrument, and a mature psychometric report will often draw on both. Table 3 summarises the principal points of contrast between the two frameworks across a range of common measurement questions (Oladunmoye, 2026b; Oladunmoye, 2026b).
Question | Classical Test Theory | Rasch measurement |
|---|---|---|
Total score | Strong focus | Secondary consideration |
Item location | Limited treatment | Central quantity |
Person location | True-score framework | Latent logit estimate |
Conditional precision | Limited | Central, by trait level |
Person-item map | Not available | Available |
Item fit | Classical indices | Rasch fit statistics |
Category functioning | Limited | Strong |
DIF | Possible, less natural | Natural extension |
Invariance | Different framework | Central theoretical goal |
Item banking | Limited | Strong foundation |
Adaptive testing | Limited | Strong foundation |
Table 3. A comparison of Classical Test Theory and Rasch measurement across common measurement questions.
41. Rasch Versus the Two-Parameter Logistic Model
The key mathematical distinction between the two models is that the Rasch model fixes ai = 1 for every item under the common logistic parameterisation, whereas in the 2PL model ai is permitted to vary freely across items. The 2PL model therefore has considerably greater flexibility to accommodate items that differ in how sharply they discriminate among respondents.
42. A Critical Issue: Data Fit Versus Measurement Construction
This section addresses perhaps the most important methodological point raised in this Research Note. There are, broadly speaking, two possible orientations that a researcher can adopt when selecting and applying a psychometric model.
Orientation A: Find a Model That Fits the Data
Under this orientation, the researcher compares a set of candidate models empirically and selects whichever one produces the best statistical fit to the observed data, treating model selection primarily as a technical or statistical exercise.
Orientation B: Define a Measurement Model and Investigate Whether the Data Support It
Under this alternative orientation, the researcher begins instead with a measurement theory, specified in advance of seeing the data in detail, and then asks whether the data conform sufficiently to that theory's model to support the intended measurement claims (Oladumoye, 2015; Oladunmoye, & Muhammad, 2024).
43. The Rasch Model as a Measurement Model
The deeper significance of Rasch analysis, considered as a whole, lies in the proposition that measurement requires more than correlation. A scale intended to support genuine measurement should ideally establish a coherent variable, an ordered set of item locations along that variable, interpretable response categories where relevant, meaningful and well-targeted person locations, adequate item coverage across the range of the trait, appropriate model fit at both the item and person level, and defensible comparisons among persons and among items.
44. Implications for PsychtrixWeb
PsychtrixWeb should therefore treat Rasch analysis as more than simply another item-response algorithm to be offered alongside CTT and 2PL/3PL options. The Rasch module can instead become a genuine measurement construction environment, organised around six functional areas.
Measurement
- item calibration and person measurement;
- reporting of locations in logits;
- separation and reliability indices for both persons and items.
Diagnostics
- infit and outfit statistics for items and persons;
- residual analysis;
- local dependence screening.
Visualisation
- item characteristic curves;
- the person-item (Wright) map;
- category probability curves for polytomous items;
- item and test information functions.
Fairness
- Differential Item Functioning analysis;
- group comparisons;
- item characteristic comparisons across groups.
Scale Development
- item refinement recommendations;
- category restructuring guidance;
- item targeting diagnostics;
- support for short-form development.
Reporting
- APA-style tables suitable for direct inclusion in manuscripts;
- publication-ready narrative interpretation;
- reproducible analysis reports with full documentation of decisions made.
45. A Proposed Rasch Research Workflow
For researchers using PsychtrixWeb, the recommended workflow runs from theory, through the item pool, through dimensionality assessment, to the Rasch model itself, then to calibration, then to fit evaluation, then to targeting, then to DIF analysis, and finally to refinement of the instrument. The sequence in which these steps are undertaken matters a great deal for the scientific defensibility of the resulting scale.
46. Example: Developing a Psychological Resilience Scale
Suppose a researcher has assembled thirty items intended to measure psychological resilience. After dimensionality analysis, one dominant factor appears plausible, and the researcher proceeds to fit a Rasch model to the item set.
47. Why Item Targeting Matters
Suppose the mean person location across a sample is 1.5 logits, while the mean item location across the instrument is 0.0 logits. The respondents in this scenario are, on average, located well above the item set as a whole, which suggests that the assessment may be too easy, or too low in overall location, for the population being studied.
48. Rasch and Precision
Rasch measurement also connects directly to the information concepts introduced in the preceding Research Note. The measurement precision available for a given person's estimate depends on the relationship between that person's location and the amount of information supplied by the items actually administered to them.
49. From Rasch to Computerised Adaptive Testing
The Rasch framework also provides a natural foundation for adaptive assessment. If a respondent's current provisional estimate is θ̂ = 1.2, an adaptive testing system built on the Rasch model can select the next item from the bank so that its location is close to that region of the latent continuum, where the item will provide the greatest amount of information about that particular respondent.
50. Ten Key Lessons
- The Rasch model is a probabilistic measurement model relating person and item locations on a shared latent continuum.
- The basic dichotomous model depends solely on the difference between a person's location and an item's location.
- Rasch parameters are conventionally expressed in logits, the natural logarithm of the odds of a positive response.
- The Rasch model assumes equal item discrimination under its standard logistic formulation, in contrast to more flexible models such as the 2PL.
- Rasch should not be treated as merely a generic 1PL model, because its associated measurement theory places stronger emphasis on invariant comparisons and on explicit model requirements that the data must satisfy.
- Unidimensionality and local independence are fundamental considerations that must be assessed before, and alongside, Rasch calibration.
- Infit and outfit statistics are useful diagnostic tools but should never be interpreted mechanically or against fixed universal cut-offs.
- The person-item map provides valuable evidence about item targeting and construct coverage that summary reliability statistics cannot provide on their own.
- Rasch analysis can contribute substantially to Differential Item Functioning and measurement-fairness investigations, though it cannot resolve fairness questions in isolation.
- A well-designed Rasch workflow integrates theory, dimensionality assessment, calibration, fit evaluation, targeting, DIF, and substantive interpretation into a single, properly sequenced process.
51. Conclusion
The Rasch model occupies a distinctive position within modern psychometrics. Mathematically, it is relatively simple, reducible to a single logistic equation relating the probability of a positive response to the difference between a person's location and an item's location:
P(Xpi = 1) = exp(θp − bi) / [1 + exp(θp − bi)]
Conceptually, however, its implications are considerably more profound than this compact equation might suggest. The model asks researchers to think of measurement itself as a relationship between persons and items located together on a common latent continuum, rather than as a matter of summing item responses into a total score. This way of thinking makes possible an integrated approach combining person measurement, item calibration, targeting, fit evaluation, separation, DIF, and invariant comparison within a single coherent framework.
The most important lesson of this Research Note is therefore not that the Rasch model is simply better than Classical Test Theory or than more flexible 2PL Item Response Theory models. Rather, the Rasch model should be understood as a specific measurement model, carrying strong requirements and distinctive measurement objectives that are not shared, at least not to the same degree, by its principal alternatives. When those requirements are theoretically appropriate to the construct at hand and are empirically supported by the available data, Rasch analysis can transform questionnaire development from a comparatively simple exercise in internal consistency into a considerably more sophisticated process of constructing and evaluating a genuine latent measurement scale.
Recommended Citation
Oladunmoye, E. O. (2026). The Rasch model and 1PL IRT: Understanding item difficulty, person ability, and invariant measurement. PsychtrixWeb Research Notes, 012. Psychtrix Initiative Limited.
References
- American Educational Research Association, American Psychological Association, & National Council on Measurement in Education. (2014). Standards for educational and psychological testing. American Educational Research Association.
- Bond, T. G., Yan, Z., & Heene, M. (2021). Applying the Rasch model: Fundamental measurement in the human sciences (4th ed.). Routledge.
- Hambleton, R. K., & Jones, R. W. (1993). Comparison of classical test theory and item response theory and their applications to test development. Educational Measurement: Issues and Practice, 12(3), 38-47.
- Kean, J., Bisson, E. F., Brodke, D. S., Biber, J., & Gross, P. H. (2018). An introduction to item response theory and Rasch analysis: Application using the eating assessment tool (EAT-10). Brain Impairment, 19(2), 91-102.
- Massof, R. W. (2011). Understanding Rasch and item response theory models: Applications to the estimation and validation of interval latent trait measures from responses to rating scale questionnaires. Ophthalmic Epidemiology, 18(1), 1-19.
- Meijer, R. R., & Sijtsma, K. (2001). Methodology review: Evaluating person fit. Applied Psychological Measurement, 25(2), 107-135.
- Oladunmoye E.O (2025). Ultra-short scales in employee assessment: balancing efficiency and accuracy. Journal of Applied Sciences, Information and Computing.6(2),103-108.
- Oladunmoye, E. O. (2026a). Validity in Psychological Assessment: Evidence, Interpretation, and Common Misconceptions. PsychtrixWeb Research Note, 005. Psychtrix Initiative Limited. https://www.psychtrixweb.online/research-notes/005-1-introduction.
- Oladunmoye, E. O. (2026b). Reliability in Psychological Measurement. PsychtrixWeb Research Note, 004. Psychtrix Initiative Limited. https://www.psychtrixweb.online/research-notes/004abstract-2
- Oladunmoye, E. O. (2026c). Cronbach's Alpha versus McDonald's Omega. PsychtrixWeb Research Note, 008. Psychtrix Initiative Limited. https://www.psychtrixweb.online/research-notes/008abstract-4
- Oladunmoye, E. O. (2026d). Exploratory Factor Analysis Versus Confirmatory Factor Analysis.
- Oladunmoye, E. O. (2026e). From Questionnaire to Validated Instrument: A Complete Psychometric Analysis Workflow Using PsychtrixWeb. PsychtrixWeb Research Note, 006. Psychtrix Initiative Limited. https://www.psychtrixweb.online/research-notes/006-1-introduction-2
- Oladunmoye, E. O., (2015). Development and validation of social provision scale on first year undergraduate psychological adjustment. Journal of Education and Practice, 6 (28), 78-90.
- Oladunmoye, E. O., Muhammad T. S., (2024). Development and Validation of Multiple Intelligence Test among emerging adults in the United Kingdom. ISAR Journal of Arts, Humanities and Social Sciences, 2(4), 18-24.
- Oladunmoye, E.O., Agbor, E.C., Olabisi, O.L., and Oyadeyi, J.B., (2024). Estimating measurement invariance on emotional intelligence scale across gender and age among undergraduates in Nigeria. Thinking Skills and Creativity Journal. 7(1),50-60
- Oladunmoye, E.O., Enamudu, G.P., and Faith, O., Nakalema, (2024). Adolescent pregnancy in Nigeria: A MIMIC modelling of Risk and Protective Factors. International Journal of Research and Innovation in Applied Science. 11(5), 2454-6194.
- Oladunmoye, E.O., Enamudu, G.P., Sa'ad, M.T. (2024). A Differential Item Functioning estimate of WAEC Mathematics test form based on gender and age among secondary school students. ISAR Journal of Multidisciplinary Research and Studies, 2(5), 15-21.
- PsychtrixWeb Research Note, 007. Psychtrix Initiative Limited. https://www.psychtrixweb.online/research-notes/007-abstract-3
- Rasch, G. (1960). Probabilistic models for some intelligence and attainment tests. Danish Institute for Educational Research.
- Reise, S. P., & Waller, N. G. (2009). Item response theory and clinical measurement. Annual Review of Clinical Psychology, 5, 27-48.
- Wright, B. D., & Masters, G. N. (1982). Rating scale analysis. MESA Press.
- Wright, B. D., & Panchapakesan, N. (1969). A procedure for sample-free item analysis. Educational and Psychological Measurement, 29(1), 23-48.
Suggested citation
PhD, E. O. O. (2026). The Rasch Model and 1PL Item Response Theory: Item Difficulty, Person Ability, and Invariant Measurement. PsychtrixWeb Research Note, 013. Psychtrix Initiative Limited. https://www.psychtrixweb.online/research-notes/013-abstractDiscuss this Research Note
Scholarly comments are welcome from anyone — no account required. Contributions are moderated before they appear.
No comments yet. Start the scholarly discussion below.