
Item Response Theory as a Modern Framework for Psychological Measurement
From Classical Scores to Latent Trait Estimation
Abstract
Classical Test Theory (CTT) has provided the foundation for much of psychological and educational measurement, but contemporary psychometric research increasingly requires models that describe measurement at the level of individual items and across the latent trait continuum. Item Response Theory (IRT) provides such a framework. Rather than treating a total test score as the primary unit of analysis, IRT models the probability of a particular response as a function of an individual's latent trait level and the characteristics of the item that produced the response. This approach makes it possible to estimate item difficulty or location, item discrimination, guessing where theoretically appropriate, and measurement precision across different regions of the latent continuum. This paper introduces IRT as a modern psychometric framework and situates it in relation to Classical Test Theory concepts that underpin scale development, reliability and validity work. It explains the latent trait concept, the item characteristic curve, the major dichotomous IRT models, item and test information, the standard error of measurement, model assumptions, calibration, scoring and applications in psychological research. Particular attention is given to a persistent misconception, namely that IRT is simply a "better version" of CTT. The two frameworks answer different measurement questions and rest on different assumptions, and a mature measurement practice draws on both. The paper proposes a practical IRT workflow, beginning with dimensionality and local independence diagnostics and proceeding through model selection, item calibration, item fit evaluation, information analysis, score estimation, differential item functioning analysis and interpretation. The framework positions IRT as a foundation for computerised adaptive testing, psychometric scale refinement, measurement fairness and next generation psychological assessment.
1. Introduction
Psychological measurement traditionally begins with a deceptively simple question: how much of a particular psychological construct does a person possess? Constructs such as depression, anxiety, self esteem, resilience, academic motivation, psychological distress, social support and emotional intelligence cannot normally be observed directly. Researchers therefore infer them from responses to observable indicators, typically the items of a questionnaire, interview schedule or performance task (Oladunmoye, 2026c; 2026d).
If theta represents an individual's latent trait, then questionnaire responses can be conceptualised as observable manifestations of that latent construct. This principle, that an unobserved psychological quantity gives rise to observed, fallible indicators, is central to modern psychometrics and underlies both Classical Test Theory and Item Response Theory, even though the two frameworks formalise the idea in different ways.
This paper builds on a broader programme of methodological work within the PsychtrixWeb Research Notes series. Earlier notes established the reasoning that this paper extends: measurement error and the meaning of an observed score; the estimation of reliability; validity as an evidence based argument rather than a fixed property of a test; scale development and psychometric evaluation; the assessment of dimensionality and factor retention; reliability estimation through coefficient alpha and omega; measurement invariance across groups; and differential item functioning. Item Response Theory provides a natural continuation of that sequence because it moves the analytical focus toward individual items and the latent trait continuum, rather than resting solely on the total test score.
Table 1 summarises this progression schematically. Each stage builds on the one before it: a construct must first be operationalised into items, the item pool must be shown to reflect one or more coherent dimensions, the reliability and validity of scores must be established, and the possibility that items function differently across groups must be examined before an item level model such as IRT can be applied with confidence.
Table 1. Progression of measurement concepts across the PsychtrixWeb Research Notes series
Stage | Guiding question | Related research note |
|---|---|---|
Construct definition | What psychological attribute is to be measured? | RN001 |
Item development | What observable indicators reflect the construct? | RN001, RN004 |
Dimensionality | Do the items reflect one dominant latent dimension or several? | RN006, RN008 |
Reliability | How consistent are the resulting scores? | RN002, RN007 |
Validity | What evidence supports the intended interpretation of scores? | RN003 |
Measurement invariance | Do scores mean the same thing across groups? | RN009 |
Differential item functioning | Do individual items behave differently across groups? | RN010 |
Item Response Theory | How does each item function across the latent trait continuum? | RN011 (this paper) |
The remainder of the paper proceeds as follows. Sections 2 to 4 contrast CTT and IRT and introduce the latent trait, the item characteristic curve and item parameters. Sections 5 and 6 present the principal dichotomous and polytomous models. Sections 7 to 9 address information, standard error and model assumptions. Sections 10 and 11 cover calibration, scoring, differential item functioning and adaptive testing. Sections 12 to 14 turn to practical workflow and applications, and Section 15 closes with key lessons and a concluding discussion.
2. What Is Item Response Theory, and How Does It Differ From Classical Test Theory?
The American Psychological Association defines Item Response Theory as a psychometric theory in which the probability of an item response is modelled as a function of an underlying latent trait or ability (American Psychological Association, 2018a, 2018b). In simplified form, the probability that an individual with latent trait level theta will endorse or correctly answer item i, written P(Xi = 1 | theta), is the central quantity that every IRT model attempts to describe. IRT thus asks a conditional question: given a person's latent trait level, how likely is a particular response to this item? This differs fundamentally from the question CTT typically asks, namely what is the person's total score, and how much error surrounds it?
From total scores to item level measurement
In CTT, a person's observed score X is often represented as X = T + E, where T is the true score and E is measurement error (American Educational Research Association, American Psychological Association, & National Council on Measurement in Education, 2014; Oladunmoye, 2026b). This model is foundational and underlies coefficient alpha and the standard error of measurement. However, the total score aggregates information across items, so two respondents with the same raw score are treated identically by CTT even if they answered quite different items correctly. IRT instead models each item response conditionally on theta, which reveals where an item functions best, how strongly it discriminates, how much information it contributes, and how a latent score can be estimated from the specific pattern of responses given, rather than from a single global summary.
IRT does not make CTT obsolete
A common oversimplification runs as follows: CTT is old, therefore IRT should replace it. That conclusion does not hold. CTT and IRT serve different purposes and are often complementary rather than competing frameworks (Hambleton & Jones, 1993). Table 2 summarises the principal points of contrast.
Table 2. Classical Test Theory and Item Response Theory compared
Feature | Classical Test Theory | Item Response Theory |
|---|---|---|
Primary unit of analysis | The total observed test score | The individual item response |
Reliability | Usually summarised as a single global coefficient | Precision can be evaluated at every point on the trait continuum |
Sample dependence | Item statistics can depend on the sample used | Parameters are model based and, under adequate fit, are comparatively sample invariant |
Central quantities | Observed score, true score, error | Item and latent trait (theta) estimates |
Measurement error | Often treated as constant across the score range | Standard error can vary systematically across theta |
Computational demand | Simple to implement with standard software | More computationally demanding, requiring specialised estimation |
Typical strength | Efficient for many conventional applications and small samples | Particularly powerful for item level modelling, scale refinement and adaptive testing |
3. The Latent Trait and the Item Characteristic Curve
The latent trait
The central variable in IRT is theta, commonly called the latent trait, ability or person parameter. For a depression scale, theta represents the level of depressive symptomatology; for an academic achievement test, theta represents underlying academic ability; for a resilience scale, theta represents underlying resilience. In each case, the latent trait is not directly observed. Instead, observed responses are passed through an IRT model to yield an estimate of theta, conventionally written theta hat. The resulting theta hat is an estimate, with an associated standard error, rather than a directly observed quantity, and this distinction matters a great deal for how scores should be interpreted and reported.
The item characteristic curve
One of the most important concepts in IRT is the item characteristic curve, or ICC. The American Psychological Association describes the ICC as a plot of the probability of answering an item correctly against the underlying ability or trait level (American Psychological Association, 2018a). Conceptually, the horizontal axis represents theta and the vertical axis represents P(Xi = 1 | theta). The resulting curve shows how the probability of endorsement changes as the latent trait increases. For a positively keyed dichotomous item, the relationship commonly resembles an S shaped logistic curve, low at low trait levels, rising through a region of rapid change, and approaching one at high trait levels.
The ICC therefore answers a precise question: at different levels of the latent trait, how likely is a person to endorse or correctly answer this item? Figure 1 illustrates three items that share the same discrimination but differ in the trait level at which they function.
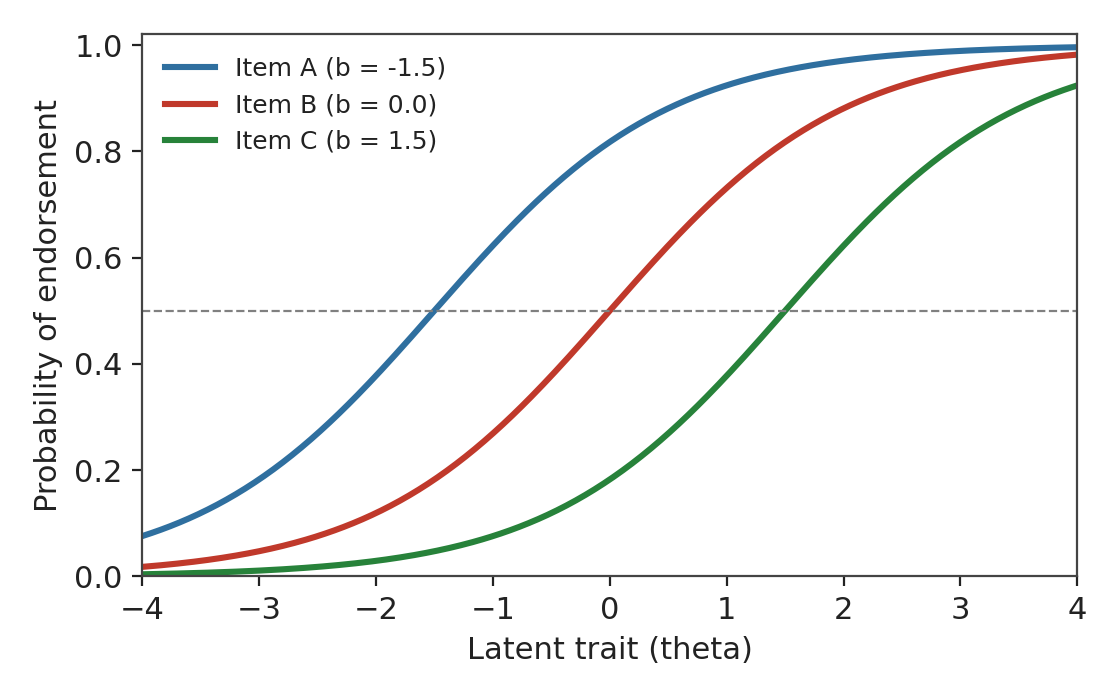
Figure 1. Item characteristic curves for three items differing only in location. Item A functions at relatively low trait levels, Item B at moderate levels and Item C at relatively high levels.
Why the item characteristic curve matters
Consider two items. Respondents with low trait levels already have a high probability of endorsing Item A, whereas only respondents with high trait levels are likely to endorse Item C. These items measure different regions of the construct, and the ICC makes this visible in a way that a simple item mean cannot. An item mean might tell us that M = 3.2 on a five point scale. The ICC can tell us substantially more, namely at what level of the latent trait endorsement becomes probable. That is a fundamentally richer measurement question, and it is the basis for much of the practical value of IRT in scale construction and item banking, discussed further in Sections 10 and 11.
4. Item Parameters: Location, Discrimination and Guessing
Item difficulty or location
The parameter commonly denoted b represents item location or difficulty. For a simple dichotomous IRT model, b is often interpreted as the trait level at which the probability of a correct response or endorsement is approximately 0.50, depending on the model parameterisation, so that P(Xi = 1 | theta = b) is approximately 0.50. An item with b = -1.5 functions at relatively low levels of the trait, while an item with b = 1.5 functions at relatively high levels. This allows researchers to construct item banks that span the latent continuum, a point developed further in Section 11.
Item discrimination
The discrimination parameter is commonly denoted a. It describes how strongly the probability of responding to an item changes as the latent trait changes. A high discrimination item has a relatively steep ICC, while a low discrimination item has a flatter curve. Higher values of a produce a steeper ICC and therefore greater differentiation among respondents around the item's location. The two parameter logistic model, introduced in Section 5, explicitly estimates this parameter for each item. Figure 2 illustrates three items that share the same location but differ in discrimination.
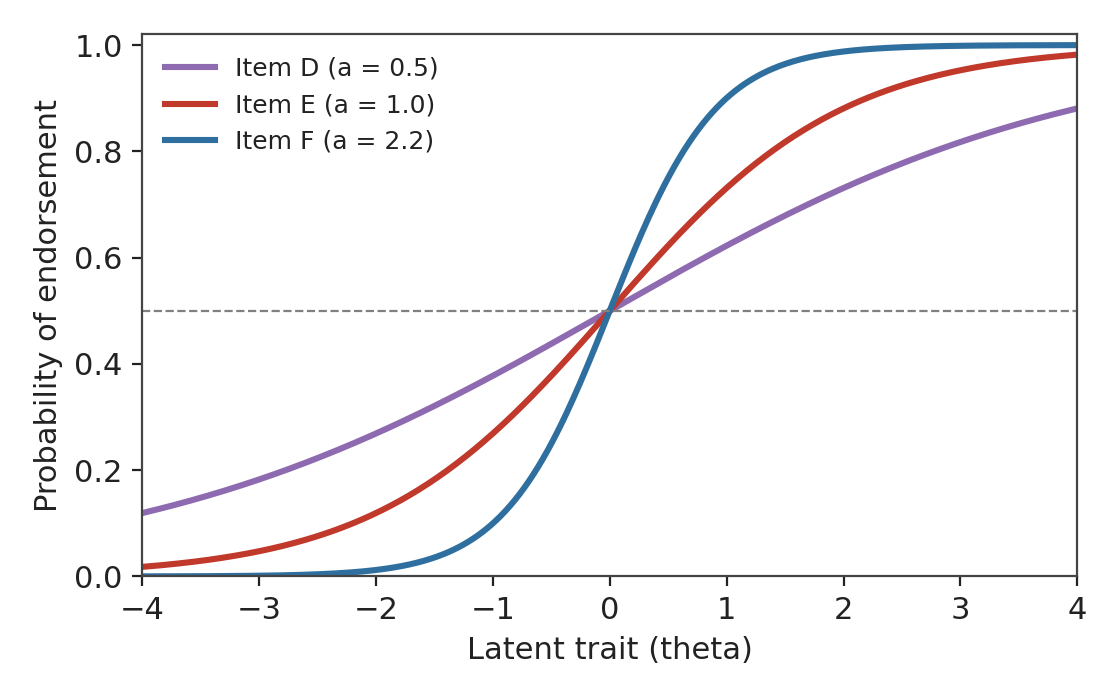
Figure 2. Item characteristic curves for three items differing only in discrimination. Item F rises steeply and differentiates respondents sharply around theta = 0; Item D rises gradually and differentiates respondents only weakly.
Guessing, or the lower asymptote
For multiple choice achievement tests, guessing may be theoretically meaningful, because a respondent with very low ability can still answer correctly by chance. The three parameter logistic model, described in Section 5, introduces a lower asymptote or pseudo guessing parameter, commonly denoted c, that represents the probability of a correct response among respondents at the extreme low end of the trait continuum. This parameter is generally less appropriate for many self report psychological scales, because guessing does not have the same conceptual meaning for an item such as "I often feel worried" as it does for a multiple choice arithmetic problem.
5. Core Dichotomous IRT Models
The one parameter logistic, or Rasch, model
The simplest logistic IRT model is the one parameter model. A common formulation is:
P(Xi = 1 | theta) = 1 / (1 + exp[-(theta - bi)])
Here theta is the person's trait level and bi is the item's location or difficulty. The model assumes equal discrimination across items. The Rasch model is often described as a one parameter model, although Rasch measurement has distinctive theoretical and measurement objectives, particularly its emphasis on specific objectivity and invariant comparisons between persons and items, that should not be reduced to the generic phrase "one parameter model". The literature distinguishes the Rasch framework from broader IRT applications even though the mathematical form can be equivalent under common parameterisations (Massof, 2011). This distinction is examined more closely in a forthcoming note in this series.
The two parameter logistic model
The two parameter logistic model introduces item discrimination explicitly:
P(Xi = 1 | theta) = 1 / (1 + exp[-ai(theta - bi)])
The two item parameters are ai, the discrimination, and bi, the location. The 2PL therefore permits different items to discriminate differently. An item with a = 2.0 will generally have a steeper response function than an item with a = 0.60. This flexibility is particularly useful when items differ substantially in their capacity to distinguish respondents across the latent continuum, as is common in heterogeneous psychological item pools.
The three parameter logistic model
The three parameter logistic model, or 3PL, introduces ci as a lower asymptote or pseudo guessing parameter:
P(Xi = 1 | theta) = ci + (1 - ci) / (1 + exp[-ai(theta - bi)])
The parameters are ai, discrimination; bi, location or difficulty; and ci, the lower asymptote associated with chance performance. The 3PL is more naturally justified for knowledge or ability tests in which guessing is plausible. It is generally less appropriate for many self report psychological scales, for the reasons noted in Section 4.
Choosing among the dichotomous models
Table 3 summarises the three dichotomous models and the circumstances under which each is typically justified.
Table 3. Dichotomous IRT models and their typical justification
Model | Parameters estimated | Typical application |
|---|---|---|
One parameter logistic (Rasch) | Location (b) only, equal discrimination assumed | Scales where invariant measurement and specific objectivity are theoretically important |
Two parameter logistic (2PL) | Location (b) and discrimination (a) | Item pools where discrimination is expected to vary meaningfully across items |
Three parameter logistic (3PL) | Location (b), discrimination (a) and guessing (c) | Multiple choice achievement or aptitude tests where correct guessing is plausible |
6. Model Selection and Polytomous Response Formats
The researcher should not begin by asking which IRT model is most advanced, but which model is theoretically and empirically appropriate for the response process at hand. For a dichotomous item, the candidates are typically the 1PL, 2PL and 3PL described in Section 5. For a Likert type item, the candidates include the graded response model, the partial credit model and the generalised partial credit model, depending on the response structure and the assumptions the researcher is willing to make.
Why Likert type items require polytomous models
Psychological instruments frequently use ordered categories such as strongly disagree, disagree, neutral, agree and strongly agree. These are polytomous rather than dichotomous responses, and researchers should not automatically collapse them into a binary coding simply to make a dichotomous IRT model easier to apply, because information is lost through dichotomisation. Models such as the graded response, generalised partial credit, partial credit and rating scale models can explicitly represent ordered categories, which matters for psychological scales where middle categories often carry genuine clinical or theoretical meaning (Oladunmoye, 2026e).
Thresholds in polytomous models
For ordered category models, the latent continuum can be divided by a set of thresholds, commonly denoted tau one, tau two and so on, representing the transitions between adjacent response categories. A graded response item models the probability that a respondent's answer falls at or above a given category, written P(X is greater than or equal to k | theta). This allows the researcher to examine whether response categories function in an ordered, meaningful manner, and whether any are rarely used or fail to discriminate between adjacent trait levels, an issue common in scales with five or more response options administered to modest samples.
A model selection heuristic
In practice, model selection can follow a short evidence guided sequence: if responses are dichotomous, choose among the 1PL, 2PL or 3PL depending on whether guessing is plausible and discrimination is expected to vary; if responses are ordered categories, choose an ordinal model such as the graded response or partial credit model. This should remain an evidence assisted process informed by theory, response format and empirical diagnostics, rather than an automatic "best model" button embedded in software.
7. Item Information and the Test Information Function
Item information
IRT introduces a powerful concept, item information, written Ii(theta). Information represents measurement precision at a particular level of the latent trait. The key relationship linking information to precision is:
SE(theta hat) = 1 / sqrt(I(theta))
so that as I(theta) increases, SE(theta hat) decreases. Higher information therefore means greater measurement precision. This differs from the global reliability perspective commonly encountered in CTT, because IRT information can vary substantially across the latent continuum, as Figure 3 illustrates for three items of differing discrimination.
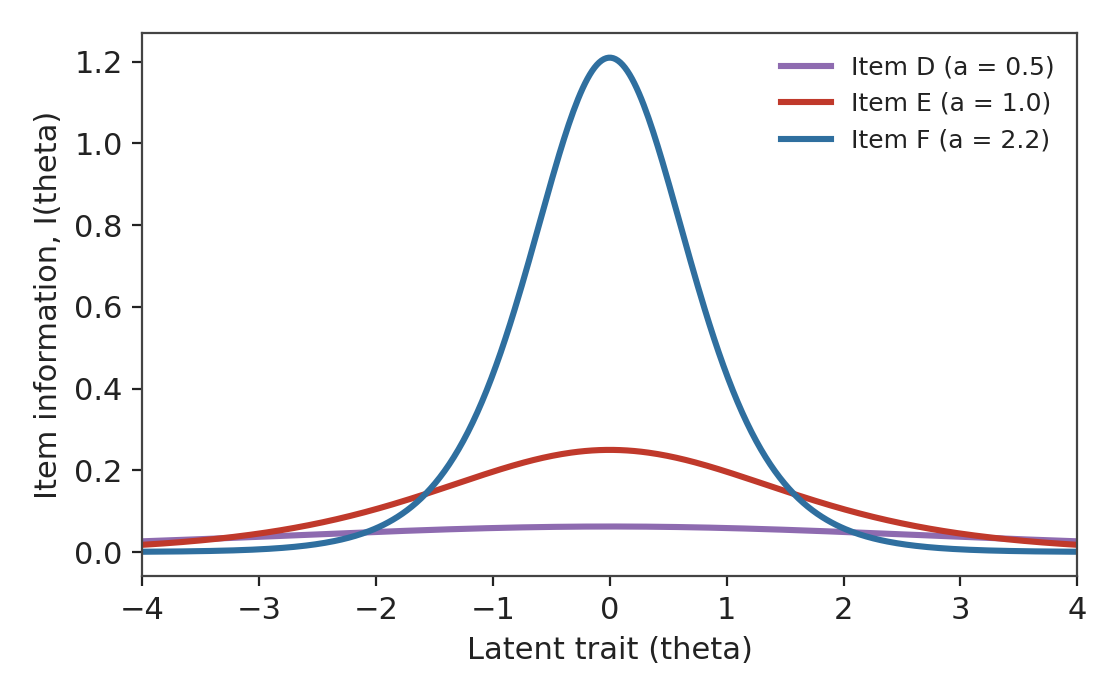
Figure 3. Item information functions for items of varying discrimination. A highly discriminating item (Item F) provides a sharp peak of information near its location, while a weakly discriminating item (Item D) provides low information spread across a wide range of theta.
The test information function
If a scale contains multiple items, their information functions can be summed directly, because information is additive under the standard local independence assumption discussed in Section 8:
I_test(theta) = sum over i of Ii(theta)
This creates the test information function, or TIF. The TIF answers a precise question: at which levels of the construct does this instrument measure most precisely? For example, an anxiety scale may provide excellent precision around moderate anxiety, weaker precision at very low anxiety, and weaker precision again at extremely high anxiety. The conventional Cronbach's alpha coefficient cannot reveal this pattern, because it collapses precision into a single number; the TIF can. Figure 4 illustrates the test information function for a five item scale, together with the associated conditional standard error, using the illustrative item bank introduced in Section 11.
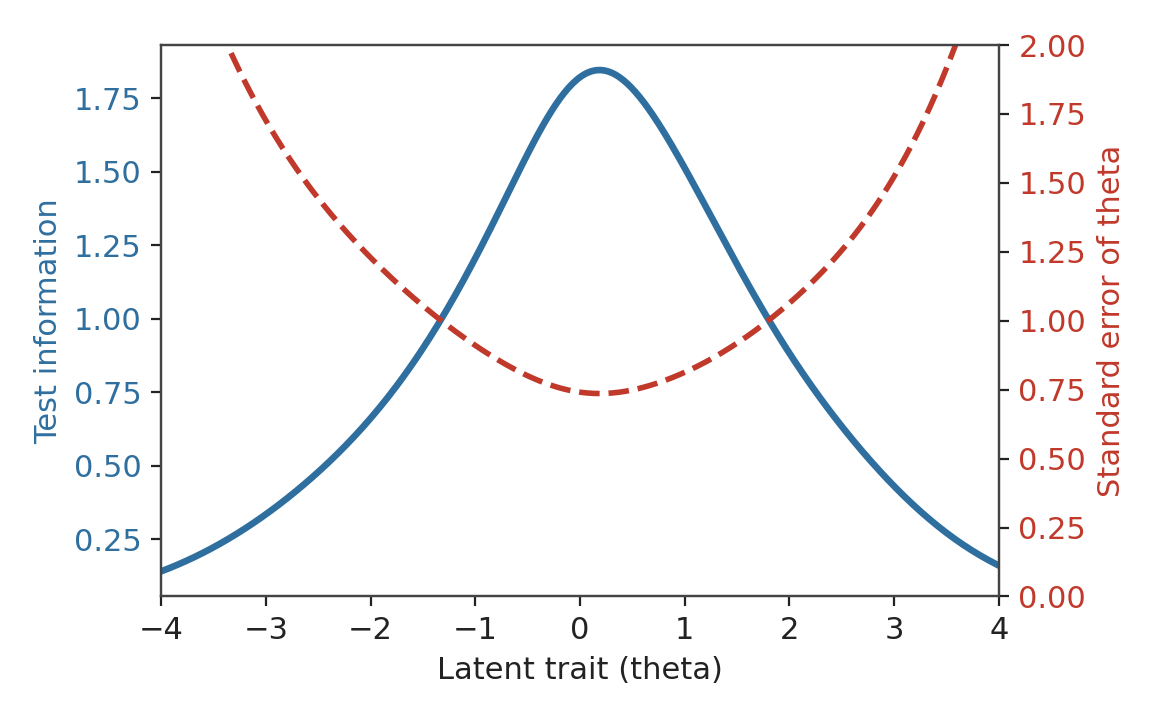
Figure 4. Test information function (solid line, left axis) and conditional standard error of theta (dashed line, right axis) for a five item scale. Precision is greatest, and the standard error smallest, in the region between roughly theta = -1 and theta = +1.
8. Standard Error and Conditional Reliability
This section extends the reasoning developed in the earlier PsychtrixWeb note on reliability estimation. Classical reliability often provides one summary estimate, for example alpha = 0.88 or omega = 0.89. IRT instead recognises that measurement precision can vary, so that the standard error at a low trait level, a middle trait level and a high trait level need not be equal. Consequently, a scale may be highly precise for some respondents and considerably less precise for others, and this is one of the central advantages of information functions in modern psychometric measurement.
Table 4 summarises the qualitative relationship between information, standard error and precision that follows directly from the equation in Section 7.
Table 4. The relationship between information, standard error and measurement precision
Information | Standard error | Precision |
|---|---|---|
High | Low | High |
Moderate | Moderate | Moderate |
Low | High | Low |
This means that a researcher should not ask only "is the scale reliable?" A more informative question, and one that an IRT analysis is well placed to answer, is "at which levels of the latent construct is the scale reliable?" This reframing has direct practical consequences for test users, because it identifies the range of the trait continuum over which a given instrument can be trusted to produce precise scores, and the ranges where scores should be interpreted with greater caution.
9. Assumptions Underlying IRT Models
IRT models are not assumption free. Modern reviews identify unidimensionality and local independence as key requirements in common IRT applications, alongside monotonicity of the response function.
Unidimensionality
Items should primarily reflect the intended latent dimension. This assumption connects directly with the earlier PsychtrixWeb notes on factor analysis and factor retention: before fitting a unidimensional IRT model, researchers should establish that the item set can reasonably be represented by a single dominant latent dimension. A scale that in fact contains two distinguishable dimensions, for example an anxiety component and a depression component, may not be adequately represented by a single theta, and forcing such data into a unidimensional model can distort both item parameters and person scores.
Local independence
After accounting for the latent trait, responses to different items should be conditionally independent of one another, so that the joint probability of the full response pattern factorises as the product of the individual item response probabilities:
P(X1, ..., Xn | theta) = product over i of P(Xi | theta)
Suppose a scale contains the items "I feel nervous" and "I feel anxious and nervous". The shared wording means responses may correlate beyond what the common latent trait predicts, violating local independence. Consequences can include inflated information, distorted item parameters and simple redundancy in the item pool, so the response structure should be examined using local dependence diagnostics before an IRT model is fitted.
Monotonicity
For many IRT models, the probability of endorsing higher scored responses should increase, or at least not decrease, as the latent trait increases. Violations of monotonicity, for example an item that becomes less likely to be endorsed at very high trait levels, can indicate problems with item wording, reverse scoring errors, or a response process that differs qualitatively from the one the model assumes (Oladunmoye, Enamudu, & Sa'ad, 2024). These assumptions should be investigated empirically, and a defensible IRT analysis reports the evidence gathered for each alongside the substantive results.
10. Calibration and Person Scoring
Calibration
Before using an IRT model operationally, item parameters must be estimated, a process called calibration. Calibration involves estimating parameters such as ai, bi and ci, depending on the model selected. The resulting item bank can then be used to estimate respondent trait levels: items are calibrated first, and trait estimation follows from the calibrated parameters. IRT calibration is therefore foundational for computerised adaptive testing and other advanced assessment systems, discussed in Section 11.
Scoring
After a respondent has answered a set of items, an individual's latent trait can be estimated, again written theta hat. Several estimation approaches are commonly used, including maximum likelihood estimation, maximum a posteriori estimation, expected a posteriori estimation and weighted likelihood approaches (Oladunmoye, 2026d). The appropriate estimator depends on the model and the assessment context; maximum likelihood estimation, for instance, is undefined for response patterns that are all correct or all incorrect, whereas Bayesian estimators such as maximum a posteriori and expected a posteriori remain well defined in these cases at the cost of some shrinkage toward the mean of the prior distribution. The resulting theta score is typically placed on a standardised latent scale, often with a mean of zero and a standard deviation of one in the calibration sample.
Why raw scores and theta scores can differ
Table 5 illustrates why IRT scoring can diverge from simple raw score totals. Two respondents may obtain an identical raw score yet receive different theta estimates, because IRT takes into account which specific items were answered correctly or endorsed, not merely how many.
Table 5. Illustrative comparison of raw scores and IRT theta estimates for two respondents
Person | Raw score | Estimated theta | Interpretation |
|---|---|---|---|
Person A | 20 | -0.20 | Correct responses concentrated on easier items |
Person B | 20 | 0.35 | Correct responses include several higher difficulty items |
Under conventional raw scoring, both respondents receive the same score. Under an IRT framework, their estimated trait levels differ because of which items they answered correctly or endorsed and the characteristics of those items. This illustrates the additional information gained through item level modelling, and it is one reason why IRT based scoring is increasingly preferred in contexts where precise, comparable measurement matters, such as clinical monitoring or high stakes testing.
11. Differential Item Functioning, Item Banking and Adaptive Testing
Differential item functioning
An earlier PsychtrixWeb note introduced differential item functioning, or DIF. IRT provides a particularly natural framework for DIF, because item parameters can be directly compared across groups. For example, a difference between bMale and bFemale could indicate location related DIF, while a difference between aMale and aFemale could indicate discrimination related DIF. This provides a direct analytic chain from IRT, through DIF, to measurement fairness. The broader literature identifies DIF as an important application of item level modelling because it can reveal differences in item functioning conditional on latent trait level, rather than relying solely on observed group mean differences, which can be confounded with genuine differences in the underlying trait between groups.
Measurement invariance revisited
An earlier note in this series examined measurement invariance using confirmatory factor analytic methods. IRT approaches the same broad comparability problem from a complementary modelling perspective. Suppose two respondents from different groups, A and B, share the same true trait level, so that thetaA equals thetaB. If the same item nonetheless produces systematically different response probabilities for the two groups, so that P(Xi | theta, A) is not equal to P(Xi | theta, B), the item may exhibit DIF. IRT therefore provides a detailed, item level mechanism for investigating cross group comparability that complements factor analytic invariance testing (Oladunmoye, Agbor, Olabisi, & Oyadeyi, 2024).
Item banking
One of the most important practical consequences of IRT is the possibility of building an item bank, a calibrated pool of items spanning the latent continuum that can be drawn upon flexibly for different testing purposes. Table 6 presents an illustrative item bank of five items covering different regions of a hypothetical trait.
Table 6. An illustrative calibrated item bank
Item | Location (b) | Discrimination (a) | Region of peak information |
|---|---|---|---|
I1 | -2.1 | 1.10 | Low trait |
I2 | -0.8 | 1.45 | Low to moderate trait |
I3 | 0.1 | 1.90 | Average trait |
I4 | 1.0 | 1.60 | Moderate to high trait |
I5 | 2.2 | 1.25 | High trait |
The bank as a whole covers different parts of the construct, which becomes extremely important for computerised adaptive testing, discussed next, and for constructing multiple parallel short forms that measure comparably at different points on the trait continuum.
Computerised adaptive testing
Computerised adaptive testing, or CAT, selects subsequent items according to the respondent's currently estimated trait level, rather than presenting every respondent with the same fixed questionnaire. Table 7 sets out the logic of a typical CAT algorithm as a sequence of steps.
Table 7. The logic of a typical computerised adaptive testing algorithm
Step | Action |
|---|---|
1 | Administer an initial item, often of moderate difficulty |
2 | Estimate theta from the response given so far |
3 | Select the next item that is most informative at the current theta estimate |
4 | Update the theta estimate using the new response |
5 | Repeat steps 3 and 4 until a stopping criterion is met |
6 | Report the final theta estimate and its standard error |
Instead of giving every respondent the same fixed questionnaire, CAT selects items dynamically, targeting each respondent's estimated trait level. A well designed CAT can achieve a desired level of precision using fewer items than a fixed form, reducing respondent burden and administration time (Reeve et al., 2007; Oladunmoye, 2025). However, shorter is not automatically better: the stopping rule should balance adequate measurement precision against sufficient content coverage and the intended use of the resulting scores, a point developed further in Section 13.
12. A Practical IRT Workflow and Reporting Standard
Item Response Theory should not be implemented as a single undifferentiated statistical procedure. A defensible applied workflow proceeds through a series of interconnected stages, each of which produces diagnostic evidence that informs the next. Table 8 sets out a proposed workflow suitable for platforms, such as PsychtrixWeb, that aim to support applied psychometric practice, as well as for individual researchers working with dedicated IRT software.
Table 8. A proposed end to end IRT analytic workflow
Stage | Purpose |
|---|---|
Data import, item coding and missing data check | Ensure response data are correctly structured, scored and free of unaddressed missingness |
Dimensionality assessment | Establish whether a unidimensional model is defensible for the item set |
Local dependence screening | Identify item pairs or clusters that may violate local independence |
Model selection | Choose a model appropriate to the response format and theoretical assumptions |
Item calibration | Estimate item parameters using an appropriate estimation method |
Item fit and ICC review | Identify items that do not conform to the fitted model and inspect curves for interpretability |
Item and test information analysis | Determine where the instrument measures most and least precisely |
Theta estimation | Estimate person trait levels and associated standard errors |
DIF analysis and item banking | Test for group differences in item functioning and compile calibrated items for reuse |
A serious psychometric platform should not simply report that "IRT completed successfully". Instead, a transparent report should document the evidence gathered at each stage of the workflow above. Table 9 sets out a recommended structure for a publication oriented IRT report, suitable for inclusion in a manuscript methods and results section.
Table 9. Recommended structure for a publication oriented IRT report
Section | Content |
|---|---|
Data | Sample size, item count, response format, missingness |
Dimensionality | Factor evidence, dominant dimension, local dependence diagnostics |
Model | Selected IRT model, rationale for selection, estimation method |
Item parameters | Discrimination, location, guessing where appropriate, thresholds for polytomous models |
Item fit | Fit statistics, flagged items, substantive interpretation of misfit |
Information | Item information functions, test information function, conditional standard error |
Differential item functioning | Grouping variable, DIF statistic, effect size, direction of the effect |
Person scores | Theta estimates, standard errors, score distribution |
Recommendations | Items to retain, review, revise, remove or investigate further |
Sample size considerations
IRT parameter estimation generally requires an adequate sample size, although the exact requirement depends on model complexity, the number of parameters and items, the response distribution, item quality, the estimation method and the desired precision. More complex models typically require more information: estimating discrimination, location and guessing parameters for every item is considerably more demanding than estimating location alone. A platform or research team should therefore provide sample adequacy guidance that is specific to the model being fitted, rather than presenting a single universal sample size rule of thumb that applies equally to a Rasch analysis of ten items and a three parameter logistic analysis of eighty items.
A worked example of publication style interpretation
Consider how the elements above might combine in a results section: "A two parameter logistic model was fitted to a 24 item resilience scale. Discrimination parameters ranged from 0.72 to 2.18 and location parameters from -2.01 to 1.87. The test information function showed greatest precision between theta = -1.0 and theta = 1.5, with reduced precision at the upper end of the trait distribution, suggesting stronger measurement for low to moderately resilient respondents than for the most resilient individuals." This is substantially more informative than a bare statement that "the scale had good reliability", because it specifies not only how well the scale measures, but where along the construct it does so.
13. Applications in Psychological Research
IRT can be applied across a wide range of psychological instruments, including depression inventories, anxiety scales, resilience measures, personality instruments, quality of life measures, academic motivation scales, self efficacy measures, social support instruments, psychological wellbeing scales and symptom inventories. It is particularly valuable when researchers want to know not merely whether an instrument is reliable, but where along the construct continuum it provides useful information. IRT has increasingly been applied to patient reported outcomes and psychological or health constructs for precisely this reason (Bjorner, Kosinski, & Ware, 2003; Reeve et al., 2007; Oladunmoye, Enamudu, & Nakalema, 2024).
IRT and psychopathology
Psychiatric and psychological constructs present particular challenges for IRT modelling. A depression scale, for example, may contain relatively few items and a strongly skewed trait distribution in the general population, since most respondents endorse few or no depressive symptoms. Methodological discussions of IRT in psychiatric measurement emphasise both its potential and its challenges, including narrow constructs, limited item pools and skewed latent distributions (Reise & Waller, 2009; Thomas, 2011). This reinforces a central principle of the present paper: IRT is powerful, but it is not assumption free, and its application to clinical constructs calls for particular methodological care.
Scale refinement
Suppose a researcher develops a 40 item resilience scale. An IRT analysis may reveal that eight items provide little information, four items have poor discrimination, three items cluster around the same trait location, two items exhibit DIF, and the scale as a whole provides weak information at low resilience. Armed with this detailed picture, the researcher can redesign the scale in a targeted way, which is considerably more informative than reporting a single omega coefficient. An item with modest discrimination is not automatically useless, however: its value also depends on content relevance, construct coverage and theoretical importance, so scale refinement decisions should weigh statistical and substantive considerations together rather than discrimination alone.
Content coverage versus statistical efficiency
An assessment should not become statistically optimised at the expense of construct representation. A depression scale optimised only for moderate symptoms might produce excellent information around theta = 0 yet perform poorly at theta = -2 and theta = +2, leaving it statistically efficient but substantively incomplete precisely for the respondents at the extremes for whom accurate measurement often matters most clinically (Oladunmoye, Muhammad, 2024; Oladunmoye, 2015). Psychometric efficiency and construct coverage should therefore jointly guide scale development.
Measurement fairness
IRT provides several tools relevant to fairness, including differential item functioning analysis, direct comparison of item parameters across groups, and comparison of information functions across groups. This connects the measurement invariance and DIF work discussed in Section 11 to a broader measurement fairness perspective. A mature psychometric practice asks not only whether an assessment produces different group means, but whether it measures the construct with comparable precision across demographic groups.
14. Ten Key Lessons
The discussion above can be distilled into ten key lessons, summarised in Table 10, that a researcher or applied psychometrician should carry forward from an introduction to Item Response Theory.
Table 10. Ten key lessons from this paper
No. | Lesson |
|---|---|
1 | IRT models the relationship between item responses and an underlying latent trait. |
2 | IRT is not simply a replacement for Classical Test Theory; the two frameworks are complementary. |
3 | The item, rather than only the total score, becomes a central unit of analysis. |
4 | The item characteristic curve describes how response probability changes across the latent trait continuum. |
5 | The b parameter represents item location or difficulty under common parameterisations. |
6 | The a parameter represents item discrimination in models that estimate it. |
7 | The three parameter logistic model adds a lower asymptote, or guessing parameter, where guessing is theoretically appropriate. |
8 | Information functions show where an assessment measures most precisely. |
9 | IRT requires careful attention to assumptions such as dimensionality, local independence and monotonicity. |
10 | IRT provides the psychometric foundation for advanced applications such as differential item functioning analysis, item banking and computerised adaptive testing. |
15. Conclusion
Item Response Theory represents a major conceptual development in psychological and educational measurement, because it allows researchers to examine measurement at the level of individual items and across the latent trait continuum. Its value is not simply mathematical sophistication for its own sake. Its deeper contribution is conceptual: whereas Classical Test Theory often asks how reliable a test is, IRT permits a more differentiated question, namely how precisely each item and the overall assessment measure different levels of the latent construct.
This distinction becomes especially important in psychological assessment, where constructs such as depression, anxiety, resilience, self efficacy and wellbeing are often distributed continuously in the population, and where measurement precision may vary substantially across the trait continuum, being strong in some ranges and weak in others. A researcher who reports only a single reliability coefficient risks obscuring exactly this kind of variation.
The integration of IRT with the framework developed across this research note series creates an increasingly coherent measurement architecture, moving from construct definition and scale development through dimensionality, reliability, validity, invariance and differential item functioning to item response modelling and adaptive testing. For applied practice, this means IRT should not be implemented merely as another statistical button in a software menu, but should function as an integrated analytical layer connecting dimensionality, item quality, precision, fairness, scoring and adaptive assessment into a single coherent practice (Oladunmoye, 2026a).
A natural next step in this series is to examine the Rasch model and the one parameter logistic model in greater depth, focusing on item difficulty, person ability and the concept of invariant measurement, and to consider more critically the conceptual distinction between the generic one parameter model and Rasch measurement theory proper.
Recommended Citation
Oladunmoye, E. O. (2026). Item response theory as a modern framework for psychological measurement: From classical scores to latent trait estimation. PsychtrixWeb Research Notes, 011. Psychtrix Initiative Limited.
References
- American Educational Research Association, American Psychological Association, & National Council on Measurement in Education. (2014). Standards for educational and psychological testing. American Educational Research Association.
- American Psychological Association. (2018a). Item characteristic curve. In APA dictionary of psychology.
- American Psychological Association. (2018b). Item response theory. In APA dictionary of psychology.
- Baker, F. B. (2001). The basics of item response theory (2nd ed.). ERIC Clearinghouse on Assessment and Evaluation.
- Bjorner, J. B., Kosinski, M., & Ware, J. E., Jr. (2003). Calibration of an item pool for assessing the burden of headaches: An application of item response theory to the Headache Impact Test (HIT). Quality of Life Research, 12(8), 913 to 933.
- Hambleton, R. K., & Jones, R. W. (1993). Comparison of classical test theory and item response theory and their applications to test development. Educational Measurement: Issues and Practice, 12(3), 38 to 47.
- Kean, J., Brodke, D. S., Biber, J., & Gross, P. (2018). An introduction to item response theory and Rasch analysis of the Eating Assessment Tool (EAT-10). Brain Impairment, 19(1), 91 to 102.
- Massof, R. W. (2011). Understanding Rasch and item response theory models: Applications to the estimation and validation of interval latent trait measures from responses to rating scale questionnaires. Ophthalmic Epidemiology, 18(1), 1 to 19.
- Oladunmoye E.O (2025). Ultra-short scales in employee assessment: balancing efficiency and accuracy. Journal of Applied Sciences, Information and Computing.6(2),103-108.
- Oladunmoye, E. O. (2026a). Validity in Psychological Assessment: Evidence, Interpretation, and Common Misconceptions. PsychtrixWeb Research Note, 005. Psychtrix Initiative Limited. https://www.psychtrixweb.online/research-notes/005-1-introduction.
- Oladunmoye, E. O. (2026b). Reliability in Psychological Measurement. PsychtrixWeb Research Note, 004. Psychtrix Initiative Limited. https://www.psychtrixweb.online/research-notes/004abstract-2
- Oladunmoye, E. O. (2026c). Cronbach's Alpha versus McDonald's Omega. PsychtrixWeb Research Note, 008. Psychtrix Initiative Limited. https://www.psychtrixweb.online/research-notes/008abstract-4
- Oladunmoye, E. O. (2026d). Exploratory Factor Analysis Versus Confirmatory Factor Analysis. PsychtrixWeb Research Note, 007. Psychtrix Initiative Limited. https://www.psychtrixweb.online/research-notes/007-abstract-3
- Oladunmoye, E. O. (2026e). From Questionnaire to Validated Instrument: A Complete Psychometric Analysis Workflow Using PsychtrixWeb. PsychtrixWeb Research Note, 006. Psychtrix Initiative Limited. https://www.psychtrixweb.online/research-notes/006-1-introduction-2
- Oladunmoye, E. O., (2015). Development and validation of social provision scale on first year undergraduate psychological adjustment. Journal of Education and Practice, 6 (28), 78-90.
- Oladunmoye, E. O., Muhammad T. S., (2024). Development and Validation of Multiple Intelligence Test among emerging adults in the United Kingdom. ISAR Journal of Arts, Humanities and Social Sciences, 2(4), 18-24.
- Oladunmoye, E.O., Agbor, E.C., Olabisi, O.L., and Oyadeyi, J.B., (2024). Estimating measurement invariance on emotional intelligence scale across gender and age among undergraduates in Nigeria. Thinking Skills and Creativity Journal. 7(1),50-60
- Oladunmoye, E.O., Enamudu, G.P., and Faith, O., Nakalema, (2024). Adolescent pregnancy in Nigeria: A MIMIC modelling of Risk and Protective Factors. International Journal of Research and Innovation in Applied Science. 11(5), 2454-6194.
- Oladunmoye, E.O., Enamudu, G.P., Sa'ad, M.T. (2024). A Differential Item Functioning estimate of WAEC Mathematics test form based on gender and age among secondary school students. ISAR Journal of Multidisciplinary Research and Studies, 2(5), 15-21.
- Reeve, B. B., Hays, R. D., Bjorner, J. B., Cook, K. F., Crane, P. K., Teresi, J. A., Thissen, D., Revicki, D. A., Weiss, D. J., Hambleton, R. K., Liu, H., Gershon, R., Reise, S. P., & Cella, D. (2007). Psychometric evaluation and calibration of health related quality of life item banks: Plans for the Patient-Reported Outcomes Measurement Information System (PROMIS). Medical Care, 45(5, Suppl. 1), S22 to S31.
- Reise, S. P., & Waller, N. G. (2009). Item response theory and clinical measurement. Annual Review of Clinical Psychology, 5, 27 to 48.
- Stochl, J., Jones, P. B., & Croudace, T. J. (2012). Mokken scale analysis of mental health and wellbeing questionnaire item responses: A non-parametric IRT method in empirical research for applied health researchers. BMC Medical Research Methodology, 12(1), Article 74.
- Thomas, M. L. (2011). The value of item response theory in clinical assessment: A review. Assessment, 18(3), 291 to 307.
Suggested citation
PhD, E. O. O. (2026). Item Response Theory as a Modern Framework for Psychological Measurement. PsychtrixWeb Research Note, 012. Psychtrix Initiative Limited. https://www.psychtrixweb.online/research-notes/012-1-introductionDiscuss this Research Note
Scholarly comments are welcome from anyone — no account required. Contributions are moderated before they appear.
No comments yet. Start the scholarly discussion below.