
Differential Item Functioning
Detecting Hidden Item Bias in Psychological and Educational Measurement
Abstract
Psychological and educational instruments are routinely used to compare individuals across sex, age, language, culture, educational background, geographical location and clinical status. Yet an apparently neutral item may function differently for individuals who possess the same underlying level of the construct being measured. This phenomenon is known as Differential Item Functioning, commonly abbreviated as DIF. DIF is a critical psychometric issue because it can compromise score comparability and, when sufficiently large or systematic, contribute to unfair or misleading conclusions about the groups being compared. This paper provides an expanded treatment of the conceptual and statistical foundations of DIF. It distinguishes DIF from simple group mean differences and from the broader notion of test bias, and it examines the uniform and non-uniform forms that DIF can take. It reviews the major statistical approaches used to detect DIF, including Item Response Theory, Rasch measurement, logistic regression, the Mantel-Haenszel procedure and multiple-group confirmatory factor analysis. Particular emphasis is placed on the distinction between statistical significance and practical significance, since large samples can render very small differences statistically detectable. The methodological literature consistently recommends that researchers evaluate DIF magnitude and test-level impact rather than relying on significance testing alone. The paper situates DIF within a broader measurement sequence that begins with construct definition and proceeds through reliability, validity, dimensionality and measurement invariance before arriving at item-level analysis. It closes with a discussion of applied contexts, including cross-cultural adaptation, clinical assessment, educational testing, computerised adaptive testing and emerging concerns about algorithmic fairness in AI-enabled assessment, and it proposes a structured decision framework and an integrated diagnostic workflow that a modern psychometric platform could implement in order to move DIF analysis beyond a binary significance test.
1. Introduction
A typical psychological or educational instrument may contain anywhere between ten and one hundred apparently straightforward items. Consider an item such as "I find it easy to concentrate on my daily activities." A researcher developing such an item might reasonably assume that two respondents who possess the same underlying level of the construct, for example the same true level of depressive symptomatology, will have approximately the same probability of endorsing it. This assumption underlies almost every comparative use of psychological measurement, from clinical screening to cross-national survey research, yet it can fail in practice. Suppose two individuals, Person A from Group 1 and Person B from Group 2, share an identical latent level of depression. If Person A nonetheless has a seventy per cent probability of endorsing a given item while Person B has only a forty per cent probability, and this discrepancy is attributable to group membership rather than to the underlying trait itself, the item is said to exhibit Differential Item Functioning.
DIF therefore poses a deceptively simple question: do people from different groups respond differently to an item even when they possess the same level of the construct being measured? The question has become central to health, psychological, educational and quality-of-life measurement, because subgroup-specific item behaviour can distort the comparisons that such instruments are designed to support. A national depression registry that unknowingly relies on items exhibiting DIF may systematically over-estimate or under-estimate the prevalence of depressive symptoms in one demographic group relative to another, with consequences for resource allocation, diagnosis and research conclusions.
This paper offers a structured account of DIF intended for researchers, test developers and applied psychometricians. It locates DIF within the wider sequence of psychometric evaluation, defines the phenomenon formally, distinguishes it from related but non-equivalent concepts, and reviews the principal statistical methods used for its detection, with particular attention to the difference between statistical and practical significance and to the measurement of DIF magnitude and impact. It closes with a discussion of applications and a proposed integrated diagnostic workflow (Oladunmoye, Enamudu & Sa'ad, 2024).
2. Positioning DIF within the Measurement Sequence
DIF should not be treated as an isolated statistical procedure run once and reported in a single line of a results section. It emerges from a developmental sequence beginning with construct definition and proceeding through reliability, validity, dimensionality and measurement invariance testing, summarised in Table 1.
Table 1. The psychometric evaluation sequence leading to item-level analysis
Stage | Guiding question | Typical methods |
|---|---|---|
Construct definition and scoring | What is the instrument intended to measure, and how are responses converted into scores? | Content analysis, item writing, pilot testing |
Reliability | Are scores measured with acceptable precision and consistency? | Cronbach's alpha, McDonald's omega, test-retest correlation |
Validity | Is there evidence supporting the intended interpretation and use of scores? | Convergent and discriminant validity, criterion studies |
Dimensionality | How many underlying dimensions do the items reflect? | Exploratory and confirmatory factor analysis, parallel analysis |
Measurement invariance | Does the measurement model operate equivalently across groups? | Multiple-group confirmatory factor analysis |
Differential item functioning | Do individual items behave differently for people with the same trait level? | IRT-based DIF, logistic regression, Mantel-Haenszel |
Two stages in this sequence, measurement invariance and DIF, are frequently conflated, yet they answer distinct questions. Measurement invariance asks whether an entire measurement model operates equivalently across groups, while DIF asks the narrower question of whether a particular item behaves differently conditional on the underlying trait. The two are complementary rather than interchangeable, and DIF can be investigated within either an IRT-based or a confirmatory factor analytic framework, a point developed further in Section 9.
Understanding DIF as one link in this longer chain has practical implications. A scale that already shows poor dimensional structure, weak reliability or unresolved measurement invariance is a poor candidate for DIF analysis in isolation, because apparent item-level anomalies may in fact reflect problems inherited from an earlier stage of the sequence rather than genuine differential functioning.
3. Defining Differential Item Functioning
Formally, DIF occurs when individuals from different groups who share a comparable level of the underlying construct have different probabilities of responding to an item in a particular way. Let P(Xi = 1 | theta, G) represent the probability of endorsing item i, conditional on the latent trait level theta and group membership G. An item is said to exhibit DIF if, for a given value of theta, the endorsement probability differs across two groups, that is, if:
P(Xi = 1 | theta, G1) is not equal to P(Xi = 1 | theta, G2)
The critical phrase in this definition is "conditional on the same level of the latent trait". Without conditioning on the underlying construct, an observed group difference in item responses is not, by itself, sufficient evidence of DIF. This conditioning requirement is what separates a rigorous DIF analysis from a superficial comparison of raw item endorsement rates between groups, and it is the single most common point of confusion among applied researchers encountering the concept for the first time.
4. DIF Is Not Simply a Group Score Difference
Suppose the mean score of Group 1 on a scale is 75 and the mean score of Group 2 is 65. This is a group difference; it is not, by itself, evidence of DIF. DIF requires a different and more precise question: among individuals who have comparable levels of the underlying construct, does group membership affect the probability of responding to a particular item? A ten-point gap in observed means could arise entirely because the two groups genuinely differ in the underlying trait, with every item functioning identically once trait level is taken into account. Equally, a scale could show no mean difference at all while still containing individual items with substantial DIF that cancel out at the total-score level, a possibility discussed further in Section 12.
Key distinction: a group mean difference reflects where two populations sit on the construct; DIF reflects whether a specific item measures the construct the same way for each population, independent of where they sit. This is why DIF analysis cannot be conducted using simple descriptive comparisons of item endorsement rates and must instead control for overall trait level, typically through matching on total score or an IRT-estimated trait score.
5. DIF and Item Bias Are Related but Not Identical
The term item bias is sometimes used interchangeably with DIF, but contemporary psychometric practice treats the two as related rather than synonymous concepts. An item can exhibit statistically detectable DIF without being substantively biased; it may function somewhat differently across groups because of legitimate cultural variation in how a construct is expressed, rather than because the item is flawed or discriminatory in any normative sense. The appropriate inferential chain therefore runs from DIF to investigation, not automatically from DIF to a conclusion that the item is biased. Reviews of the DIF literature consistently emphasise this distinction and stress the importance of considering the practical consequences of DIF, rather than statistical significance alone, before an item is labelled as biased (Jones, 2019; Zumbo, 1999; Oladunmoye, & Muhammad 2024). Establishing whether observed DIF reflects genuine bias, as opposed to a legitimate manifestation difference, ultimately requires content expertise and contextual evidence that no statistical test alone can supply.
6. An Illustrative Example
Consider a researcher developing a scale to measure academic self-efficacy. One item states: "I feel confident speaking in front of a large class." Two students, Student A from Group 1 and Student B from Group 2, share an identical latent self-efficacy level of theta equals 0.50, yet the probability of endorsing the item is 0.80 for Student A and only 0.55 for Student B. This pattern may represent DIF, but a statistical finding of this kind identifies a problem without explaining it: possible explanations a researcher would need to investigate include differing cultural norms around public speaking, differential familiarity with the classroom format described, translation artefacts, or wording that inadvertently privileges one group's experience. The statistical result is the starting point for a substantive inquiry, not its conclusion.
7. Uniform DIF
Uniform DIF occurs when the difference between groups in the probability of item endorsement is relatively constant across the entire range of the latent trait. In a two-parameter IRT model, uniform DIF typically involves a difference in item difficulty or location between groups, while item discrimination remains comparable. Figure 1 illustrates this pattern using simulated item characteristic curves for a reference group and a focal group that differ only in item location.
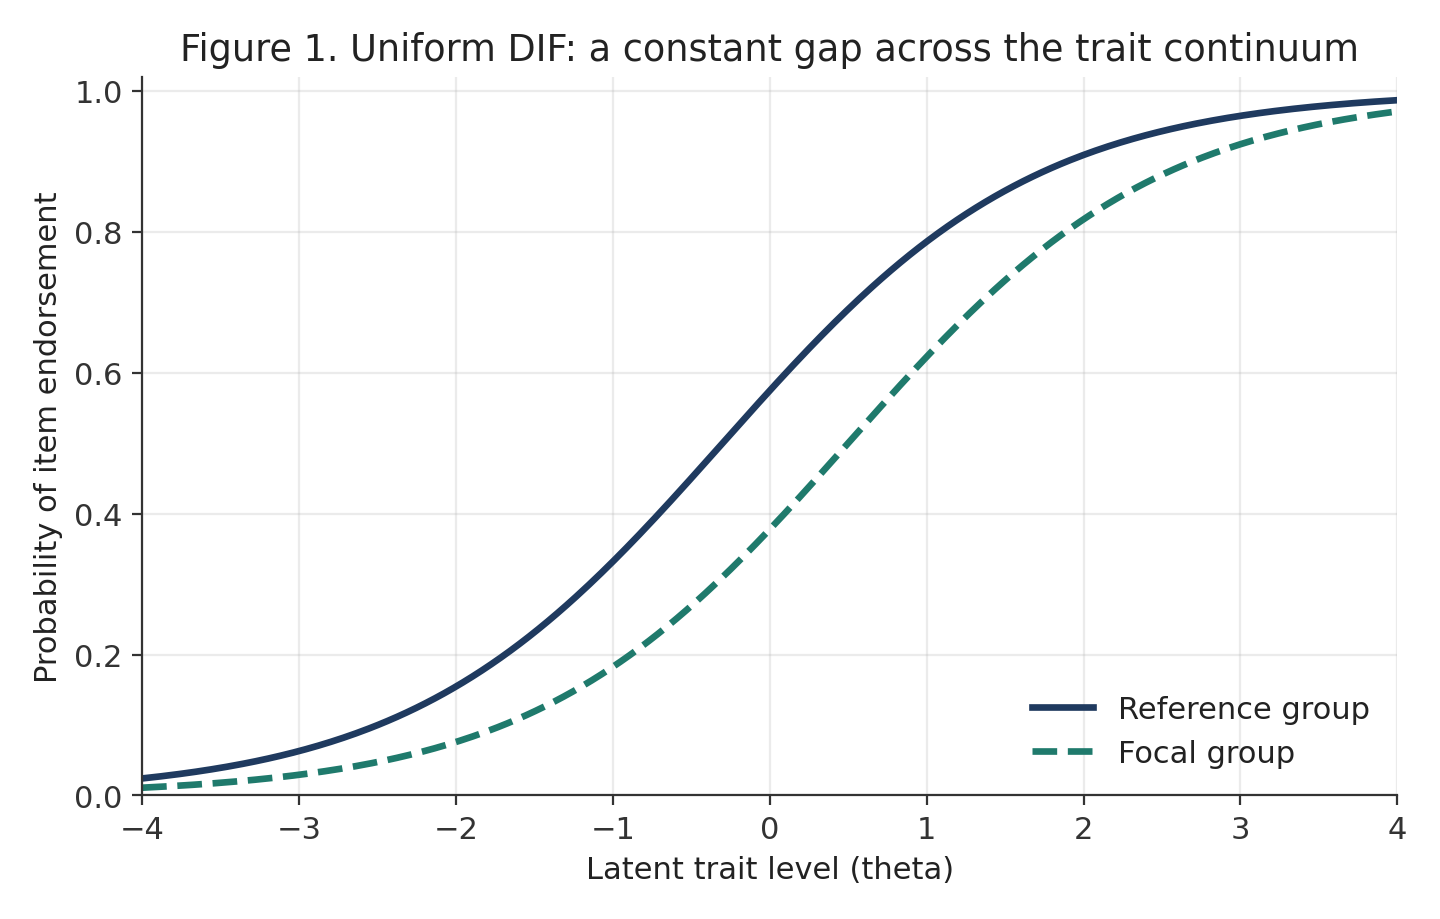
Figure 1. Uniform DIF: item characteristic curves for the reference and focal groups remain approximately separated by a constant amount across the trait continuum.
In this pattern, one group is systematically advantaged or disadvantaged relative to the other at every trait level. Because the gap does not change direction or magnitude appreciably across theta, uniform DIF is generally the easier of the two forms to detect and is well captured by methods, such as the Mantel-Haenszel procedure, that summarise a single overall odds ratio across the trait continuum.
8. Non-uniform DIF
Non-uniform DIF occurs when the magnitude or direction of the group difference changes across the latent trait continuum. One group may have a higher probability of endorsing an item at low trait levels but a lower probability at high trait levels, or vice versa. This pattern corresponds statistically to an interaction between trait level and group membership, and Figure 2 illustrates the crossing item characteristic curves that result when the two groups differ in item discrimination rather than, or in addition to, item location.
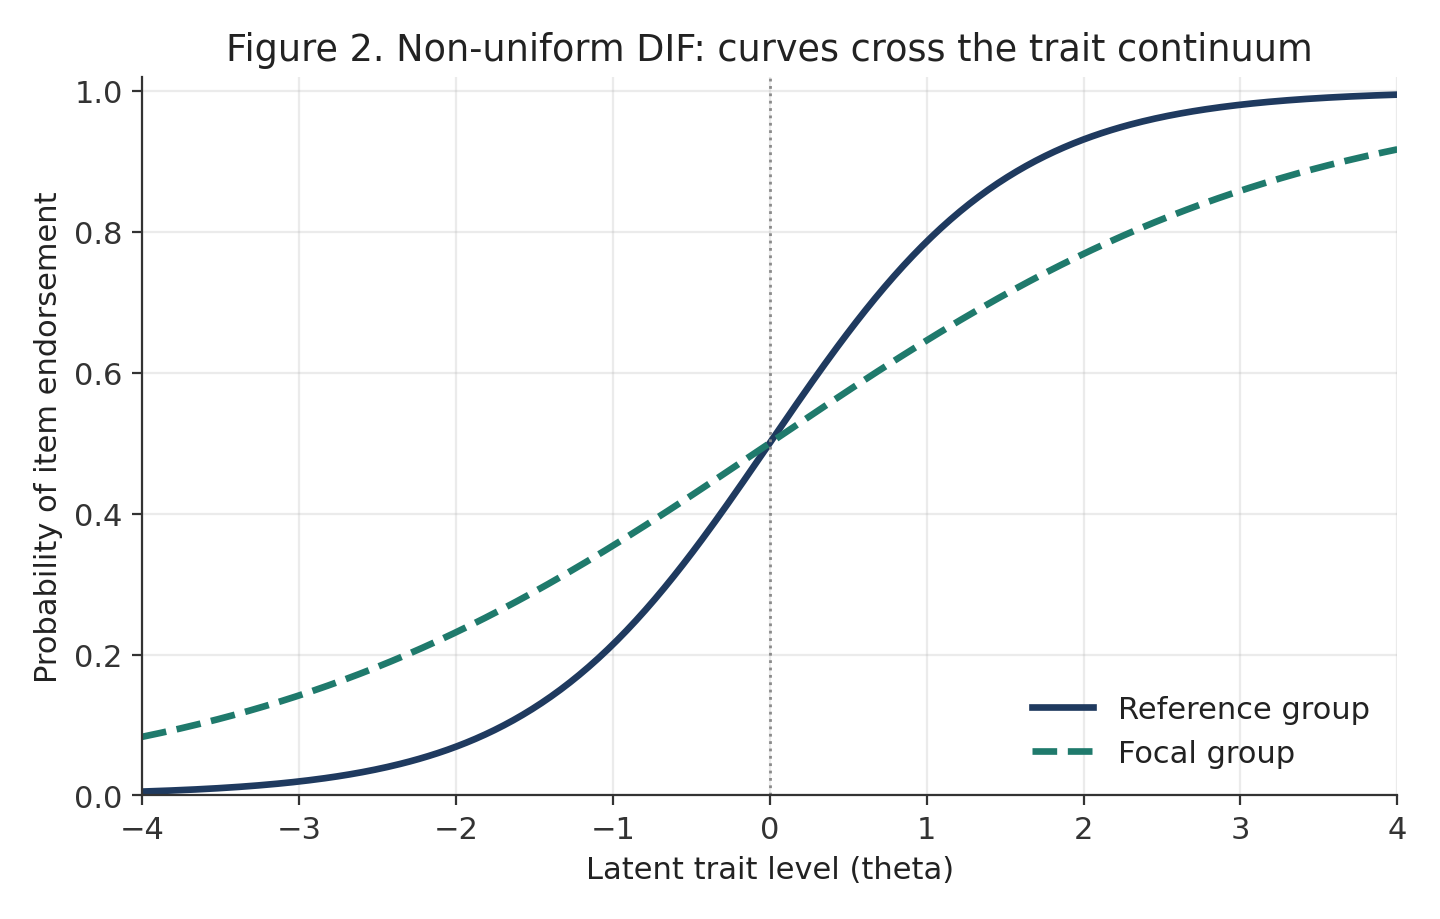
Figure 2. Non-uniform DIF: the item characteristic curves for the two groups cross, so the direction of advantage reverses across the trait continuum.
Non-uniform DIF is more complicated to detect and interpret than the uniform form, because methods that summarise group differences with a single statistic averaged across the trait range can fail to detect it, or can detect a spuriously small overall effect that masks substantial local differences. Logistic regression models that include a trait-by-group interaction term, and IRT-based likelihood ratio tests that allow discrimination parameters to vary across groups, are the methods best suited to identifying this pattern.
9. Statistical Approaches to DIF Detection
A range of statistical methods has been developed for DIF detection, each rooted in a different measurement tradition. This section reviews the five approaches most frequently encountered in the applied literature: Item Response Theory, Rasch measurement, logistic regression, the Mantel-Haenszel procedure, and multiple-group confirmatory factor analysis. Comprehensive software implementations exist for most of these methods, including the widely used difR package for the R statistical environment, which collects nine classical and modern DIF detection procedures within a single framework (Magis, Beland, Tuerlinckx & De Boeck, 2010; Oladunmoye, Agbor, Olabisi, & Oyadeyi, 2024).
9.1 Item Response Theory
Item Response Theory models the relationship between the latent trait theta and the probability of a particular item response. For a two-parameter logistic model, the probability of endorsing item i is given by:
P(Xi = 1 | theta) = 1 / (1 + exp[-ai(theta - bi)])
where ai denotes item discrimination and bi denotes item difficulty or location. DIF can be examined within this framework by estimating item parameters separately within each group and testing whether the discrimination parameter, the difficulty parameter, or both, differ meaningfully between groups. A difference in discrimination parameters across groups suggests discrimination-related DIF, which typically manifests as non-uniform DIF, while a difference confined to the difficulty parameter suggests uniform DIF. Figure 4 illustrates how a difference in discrimination alters the amount of statistical information an item provides at each level of the trait, even when overall difficulty is comparable across groups.
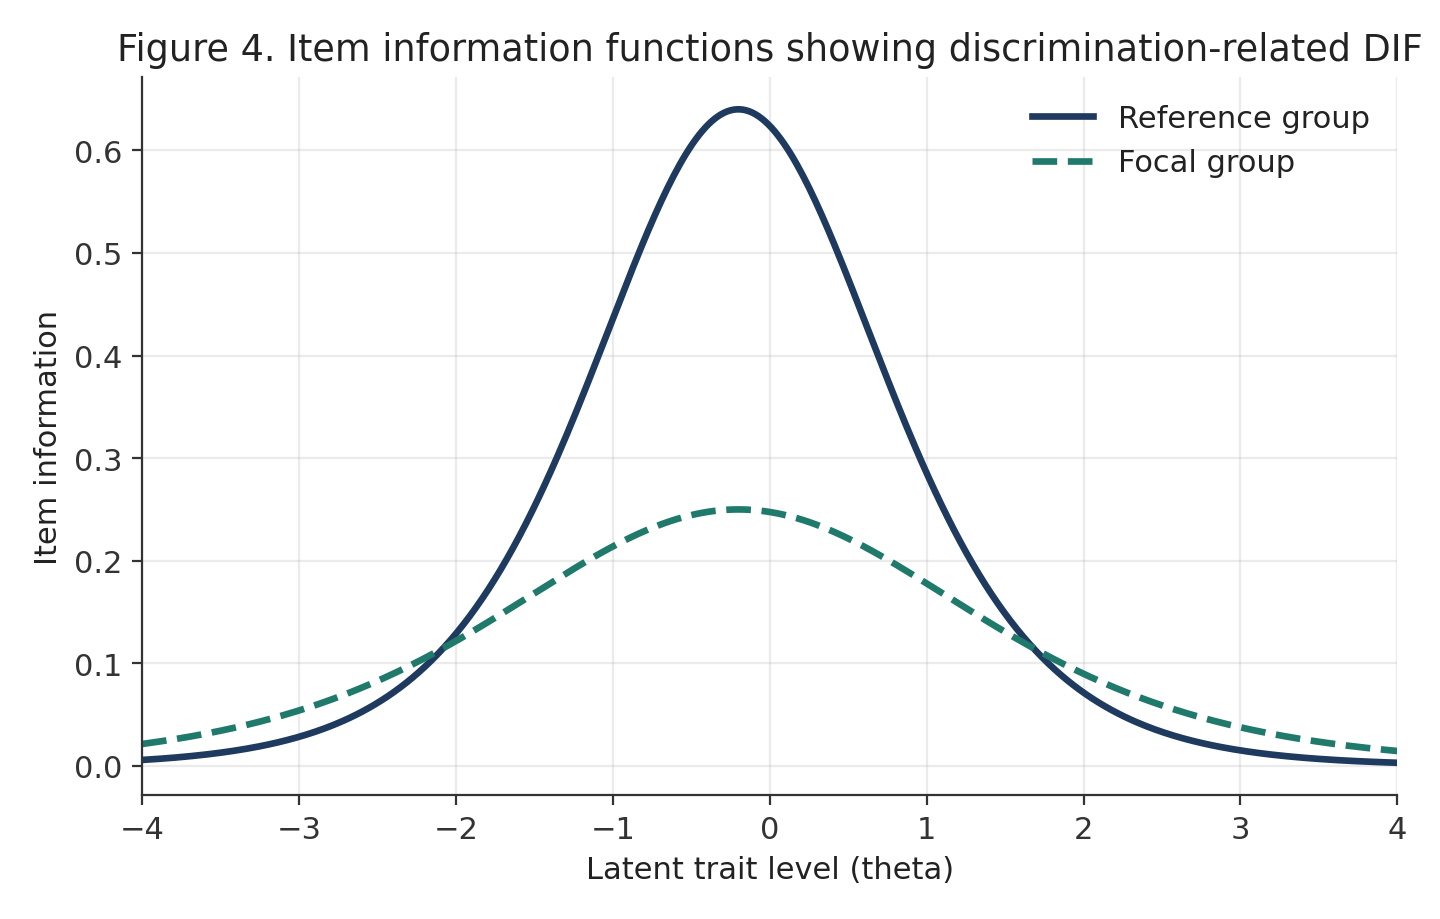
Figure 4. Item information functions for a reference group and a focal group differing in discrimination. The reference-group item provides more measurement precision across the trait range, a pattern consistent with discrimination-related (non-uniform) DIF.
9.2 Rasch Measurement
The Rasch model offers a particularly interpretable framework for DIF because it constrains all items to share a common discrimination parameter, leaving item difficulty, or location, as the sole parameter that can vary. In the simple dichotomous Rasch model, the probability that person p endorses item i is:
P(Xpi = 1) = exp(theta_p - b_i) / [1 + exp(theta_p - b_i)]
If the item location parameter b_i differs between two groups, the item may demonstrate DIF, and the size of this difference in logits provides a directly interpretable measure of DIF magnitude. Methodological work in health measurement has emphasised the value of combining statistical significance testing with this kind of effect-size information when evaluating Rasch-based DIF (Kleinman and Teresi, 2016).
9.3 Logistic Regression
DIF can also be detected through ordinal or binary logistic regression. A basic model predicting the log-odds of item endorsement might include the matching trait score theta, group membership G, and their interaction:
logit[P(Xi = 1)] = b0 + b1(theta) + b2(G) + b3(theta x G)
A statistically significant coefficient on the group term, b2, is typically interpreted as evidence of uniform DIF, while a significant coefficient on the trait-by-group interaction term, b3, is evidence of non-uniform DIF. This framework, developed extensively by Swaminathan and Rogers (1990) and later generalised for ordinal response formats, remains one of the most flexible and widely applied DIF methods because it accommodates dichotomous and polytomous items, continuous or categorical matching variables, and more than two comparison groups within a single regression framework. A comparative evaluation of criteria for flagging DIF under this approach found that significance-only criteria flagged far more items than criteria incorporating an effect-size threshold, underlining the importance of the magnitude considerations discussed in Section 10 (Crane et al., 2007; Oladunmoye, Oyedele, Enamudu, & Nakalema, 2024).
9.4 The Mantel-Haenszel Procedure
The Mantel-Haenszel procedure, adapted for DIF detection by Holland and Thayer (1988), is one of the earliest and most widely used approaches for dichotomously scored items. It compares item responses between a reference group and a focal group while stratifying respondents into levels of a matching variable, usually total test score, that proxies the underlying trait, asking whether group membership predicts item performance among people at comparable levels of this matching variable. The method yields a common odds ratio summarising the strength and direction of DIF, and has long been favoured in large-scale testing programmes for its computational simplicity; modern applications increasingly use it alongside, rather than instead of, IRT-based and logistic regression methods.
9.5 Multiple-Group Confirmatory Factor Analysis
DIF detection is not restricted to the item response theory tradition. Multiple-group confirmatory factor analysis can identify item-level noninvariance by testing for differences in factor loadings and intercepts across groups: a difference in loading corresponds broadly to discrimination-related, non-uniform DIF, while a difference in intercept corresponds broadly to the uniform form. This creates a direct conceptual bridge between item-level DIF and the model-level measurement invariance testing addressed by a companion paper in this series, and the two approaches can be understood as investigating the same underlying question from different modelling perspectives (Millsap, 2011).
9.6 Comparative Summary
Table 2 summarises the five approaches reviewed above, together with their typical data requirements, the DIF forms they are best suited to detect and their principal strengths and limitations.
Table 2. Comparison of major statistical approaches to DIF detection
Method | Typical data | Best suited to | Principal strength | Principal limitation |
|---|---|---|---|---|
Item Response Theory | Dichotomous or polytomous items, moderate to large samples | Uniform and non-uniform DIF | Separate discrimination and difficulty parameters give precise diagnosis | Requires larger samples and careful model fit checking |
Rasch measurement | Dichotomous or polytomous items | Uniform DIF (location shifts) | Highly interpretable logit-scale effect size | Assumes equal discrimination across items by design |
Logistic regression | Any item format, flexible matching variable | Uniform and non-uniform DIF | Flexible, extends to multiple groups and covariates | Sensitive to choice and quality of matching variable |
Mantel-Haenszel | Dichotomous items | Uniform DIF | Simple, well established, minimal sample size demands | Weak power for non-uniform DIF |
Multiple-group CFA | Continuous or ordinal items, latent factor model | Loading and intercept noninvariance | Connects directly to measurement invariance testing | Requires a well-fitting baseline factor model |
10. Statistical Significance Versus Practical Significance
A DIF test statistic accompanied by a p-value below .001 looks impressive, but statistical significance and practical importance are not the same thing. An estimated difference in item difficulty of only 0.03 logits may be statistically detectable in a very large sample yet substantively trivial, producing no meaningful consequence for any test taker's score. Conversely, a meaningful effect observed in a modestly sized sample may fail to reach conventional significance simply because the study was underpowered to detect it.
Guiding principle: statistical significance answers the question of whether an effect is detectable given the sample size; practical significance answers the question of whether the effect matters. Both should be reported, but only the second should drive decisions about an item's fate.
This echoes a long-standing concern in the wider quantitative literature about the over-interpretation of p-values divorced from effect size (Crane et al., 2007; Jones, 2019). Very large calibration samples, now common in online and registry-based data collection, can render almost every item statistically flagged if significance alone is the criterion, so a psychometric platform should embed effect-size and impact information alongside any significance test as default practice, not as an optional extra.
11. DIF Magnitude and Effect Size Indices
Researchers should report a quantitative estimate of DIF magnitude wherever the chosen detection method permits. The specific index available depends on the modelling framework, but common choices include the difference in item difficulty or location parameters between groups, the difference in discrimination parameters, an odds-ratio-based effect measure from the Mantel-Haenszel or logistic regression approach, a pseudo R-squared statistic quantifying the additional variance explained by group membership, a standardised mean-difference-type effect size, the expected score difference implied by the item parameters, and IRT-based area measures that integrate the gap between item characteristic curves across the trait continuum.
Table 3 lists commonly cited conventions for interpreting the magnitude of DIF under several of these indices, adapted from guidance developed for large health-related quality-of-life measurement programmes. Kleinman and Teresi (2016) note that different magnitude indices do not always agree closely with one another, so researchers should be cautious about treating any single threshold as definitive and should, where feasible, examine more than one index.
Table 3. Illustrative conventions for classifying DIF magnitude
Index | Negligible | Small to moderate | Large |
|---|---|---|---|
Mantel-Haenszel delta (ETS classification) | less than 1.0 | 1.0 to 1.5 | greater than 1.5 |
Standardised difficulty difference (logits) | less than 0.20 | 0.20 to 0.50 | greater than 0.50 |
Nagelkerke pseudo R-squared (logistic regression) | less than .035 | .035 to .070 | greater than .070 |
Signed area between item characteristic curves | less than 0.10 | 0.10 to 0.20 | greater than 0.20 |
These thresholds should be treated as heuristics rather than fixed rules. The appropriate cut-off in a given application depends on the stakes attached to the instrument, the consequences of a false positive or false negative classification, and the substantive plausibility of the explanations available for the observed pattern.
12. DIF Impact and Differential Test Functioning
A distinction that is easily overlooked is the difference between DIF magnitude and DIF impact. Magnitude asks how much a particular item differs between groups; impact asks how much that difference affects the overall test or scale score that respondents ultimately receive. The two are related but not equivalent, because the practical consequence of item-level DIF depends heavily on how many DIF items a scale contains and on whether their effects point in the same or opposite directions, as the worked example in Section 13 illustrates.
The aggregate consequence of item-level DIF for the overall test is often described as Differential Test Functioning (DTF). A test may contain several items flagged for DIF yet demonstrate a relatively small overall DTF effect, or conversely may show meaningful DTF driven by the cumulative, same-direction contribution of several individually modest items. Statistical procedures exist specifically for evaluating this test-level consequence while accounting for sampling variability in the item-level estimates that feed into it. DTF therefore provides the conceptual bridge between item fairness and test fairness, and no DIF analysis is complete without at least a qualitative consideration of it.
13. A Worked Numerical Example
To illustrate the distinction between magnitude and impact concretely, consider a hypothetical thirty-item anxiety scale in which five items are flagged for DIF during a routine calibration exercise comparing a male and a female respondent sample. Table 4 reports the standardised DIF effect size and direction for each flagged item, and Figure 3 displays the same information graphically against an illustrative practical-significance threshold of 0.20.
Table 4. DIF magnitude and direction for five flagged items in a hypothetical thirty-item anxiety scale
Item | Standardised DIF effect | Classification | Direction |
|---|---|---|---|
Item 4 | 0.28 | Moderate | Favours reference group |
Item 8 | 0.09 | Negligible | Favours focal group |
Item 12 | 0.31 | Moderate | Favours reference group |
Item 21 | 0.10 | Negligible | Favours focal group |
Item 27 | 0.52 | Large | Favours reference group |
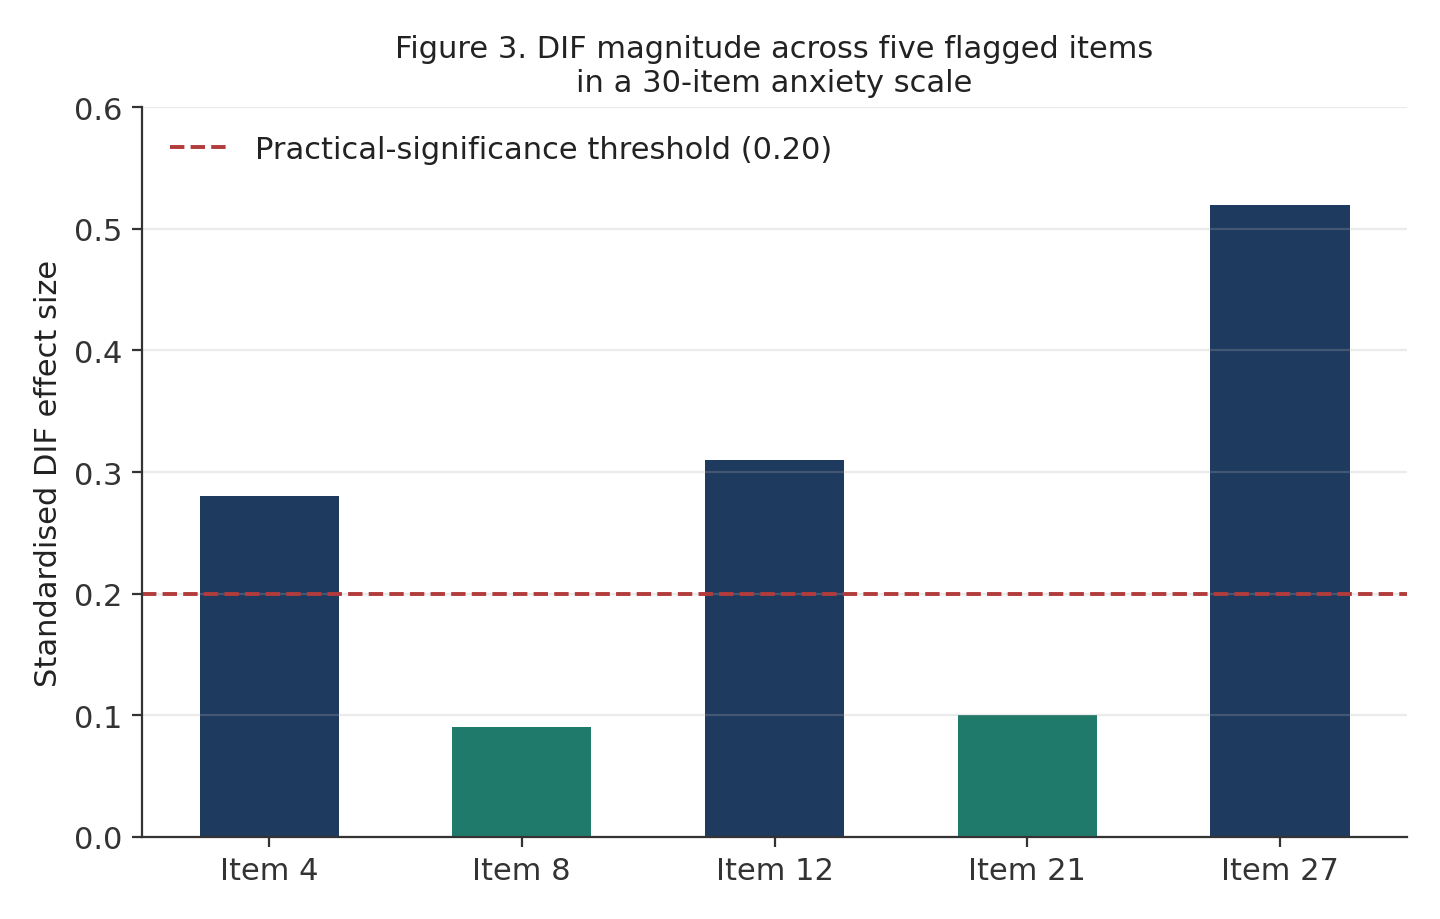
Figure 3. DIF magnitude for five flagged items relative to an illustrative practical-significance threshold of 0.20. Bars above the threshold line warrant substantive review; bars below it are statistically detectable but of limited practical concern.
A naive interpretation of this table might simply report that "five of thirty items showed statistically significant DIF". A more informative interpretation asks what the aggregate effect on estimated anxiety scores is likely to be. Because three of the five items, including the single large effect on Item 27, all favour the reference group, their contributions are likely to accumulate rather than cancel, producing a non-trivial DTF effect at the total-score level even though two of the five flagged items, Item 8 and Item 21, are negligible in isolation. This is precisely the pattern that a magnitude-only or a significance-only summary would fail to communicate, and it illustrates why Items 4, 12 and 27 would be prioritised for substantive content review ahead of the other two.
14. A Decision Framework for Responding to DIF
A recurring error in applied DIF analysis is to treat a positive finding as an automatic instruction to delete the item. This is rarely the correct response. An item exhibiting DIF should first be investigated, and the range of appropriate actions is considerably broader than deletion. Depending on the findings, a researcher might choose to retain the item as is, revise its wording, investigate a possible translation problem, model group-specific item parameters explicitly within the scoring algorithm, remove the item from the scale, develop group-specific interpretive norms, or simply document the finding and retain the item if its overall impact on scale-level scores is negligible.
The correct decision depends jointly on the magnitude of the effect, its direction, the substantive content of the item, its theoretical importance to the construct, and the item's contribution to overall scale-level impact. Table 5 sets out a practical decision matrix combining statistical evidence, effect size and test-level impact into a small number of recommended interpretive categories.
Table 5. A practical decision matrix for interpreting DIF findings
Statistical evidence | Effect size | Test-level impact | Recommended interpretation |
|---|---|---|---|
None | Small | Negligible | No evidence of meaningful DIF; no action required |
Significant | Small | Negligible | Statistical DIF with limited practical concern; document and monitor |
Significant | Moderate | Moderate | Investigate item content and possible substantive explanations |
Significant | Large | Large | High-priority review; consider revision, removal or group-specific modelling |
Significant | Large | Negligible | Examine possible cancellation with other items operating in the opposite direction |
Mixed across methods | Mixed across methods | Unclear | Conduct additional investigation using a second detection method before deciding |
This matrix is intentionally more informative than a bare significance test, and it can be operationalised as an explicit eight-step procedure:
- Detect statistical DIF using at least one established method appropriate to the item format.
- Estimate the effect magnitude using an appropriate index, ideally cross-checked against a second index.
- Determine the direction of the effect and which group is advantaged.
- Examine item response curves or item characteristic curves visually to distinguish uniform from non-uniform patterns.
- Evaluate the item's contribution to test-level impact or Differential Test Functioning.
- Review the substantive content of the item in light of the observed pattern.
- Consider cultural, linguistic or contextual explanations with input from content experts familiar with the populations concerned.
- Decide whether intervention, ranging from documentation to removal, is justified given the totality of evidence.
Following this sequence prevents a single significance test from becoming an automatic deletion mechanism, and it keeps the ultimate decision anchored in both statistical evidence and substantive judgement, a combination that the literature consistently recommends over reliance on either source of evidence alone.
15. Applications of DIF Analysis
15.1 Health, Education and Clinical Measurement
DIF analysis has been applied extensively to patient-reported outcome measures assessing physical functioning, cognition, general distress, headache burden and depression. A review of DIF applications in health research found extensive use across quality of life, physical functioning, cognition and mental health measurement, and stressed that the practical consequences of DIF, rather than its mere statistical presence, should guide whether a health measure requires revision (Jones, 2019). Item pools built for computerised adaptive testing of headache impact, for instance, have relied on the IRT calibration procedures described in Section 9.1 to ensure item parameters generalise across patient subgroups (Bjorner, Kosinski & Ware, 2003; Oladunmoye, 2025; Oladunmoye, Enamudu, & Sa'ad, 2024).
In education, an item measuring mathematics ability might, despite equal underlying ability, prove more difficult for one language group than another because its wording embeds a culturally unfamiliar scenario, introducing construct-irrelevant difficulty that DIF analysis is well placed to flag before an item enters operational use (Hambleton and Jones, 1993). In clinical assessment, two patients with equivalent depression levels may differ in their likelihood of endorsing a somatic symptom item for cultural or contextual reasons; the item may still exhibit DIF without the symptom itself being unimportant, and the question becomes especially consequential when a diagnostic cut score depends directly on the total score.
15.2 Cross-Cultural Adaptation, Intersectionality and Emerging Contexts
Cross-cultural research provides one of the most important applications of DIF. Even a carefully translated instrument cannot guarantee that every item will function identically once it moves between linguistic and cultural contexts, owing to differing conceptualisations of the construct, residual translation effects, social norms shaping response style, or genuinely different manifestations of a symptom. Systematic reviews of cross-cultural measurement show that DIF testing can reveal functioning differences that translation quality checks alone would miss, supporting a preferred sequence of translation, cultural adaptation and DIF testing rather than an assumption of automatic equivalence (Oladunmoye, Agbor, Olabisi, & Oyadeyi, 2024).
Traditional analyses compare a single reference group against a single focal group, yet individuals simultaneously occupy multiple demographic positions defined by age, sex, education and location together. Contemporary DIF methodology increasingly considers several background variables and their interactions at once, for example the joint influence of gender, age and educational context, which is more demanding computationally but potentially far more informative, and represents an important direction for future work.
Two further contexts deserve mention. In computerised adaptive testing, an algorithm selects each item based on the test taker's estimated trait level, so an item bank containing unaddressed DIF can be selected disproportionately for one group, biasing the resulting trait estimate in a way fixed-form testing does not; DIF screening is thus a prerequisite for adaptive testing, not an optional supplement. More broadly, assessment systems that score text, speech or digital behaviour using machine-learning models can produce systematically different predictions across groups even when no single feature targeted any group, extending the logic of DIF from item bias to algorithmic measurement fairness.
16. Towards an Integrated Diagnostic Workflow
A modern psychometric platform should not reduce DIF analysis to a binary flag of "DIF: yes or no" for each item. A more useful system produces a complete diagnostic profile for every item under review, combining statistical evidence, an effect-size estimate, the direction of the effect and a qualitative judgement of its practical impact. Table 6 illustrates the structure of such a diagnostic output for a small set of items.
Table 6. Illustrative structure of an item-level DIF diagnostic report
Item | Method | Statistical evidence | Effect size | Direction | Impact classification |
|---|---|---|---|---|---|
I1 | IRT likelihood ratio | None | 0.02 | n/a | Negligible |
I2 | IRT likelihood ratio | Significant | 0.18 | Favours Group A | Small |
I3 | IRT likelihood ratio | Significant | 0.62 | Favours Group B | Moderate to large |
I4 | IRT likelihood ratio | None | 0.04 | n/a | Negligible |
On the basis of a report structured in this way, items can be sorted into a small number of decision categories, such as no meaningful DIF, statistical DIF with negligible impact, meaningful DIF warranting review, and high-priority review, a classification considerably more useful to an applied researcher than a single binary significance outcome.
Such a system can also be paired with a set of standard visual diagnostics: item characteristic curve comparisons across groups, item information function comparisons of the kind shown in Figure 4, item parameter scatter plots comparing discrimination and difficulty estimates across groups, test characteristic curve comparisons for evaluating aggregate DTF, and ranked DIF magnitude plots of the kind shown in Figure 3. Figure 5 places this diagnostic capability within the broader measurement workflow introduced in Section 2, extending it forward from DIF detection into magnitude and impact assessment, item review and scale refinement, and ultimately into score interpretation and adaptive test deployment.
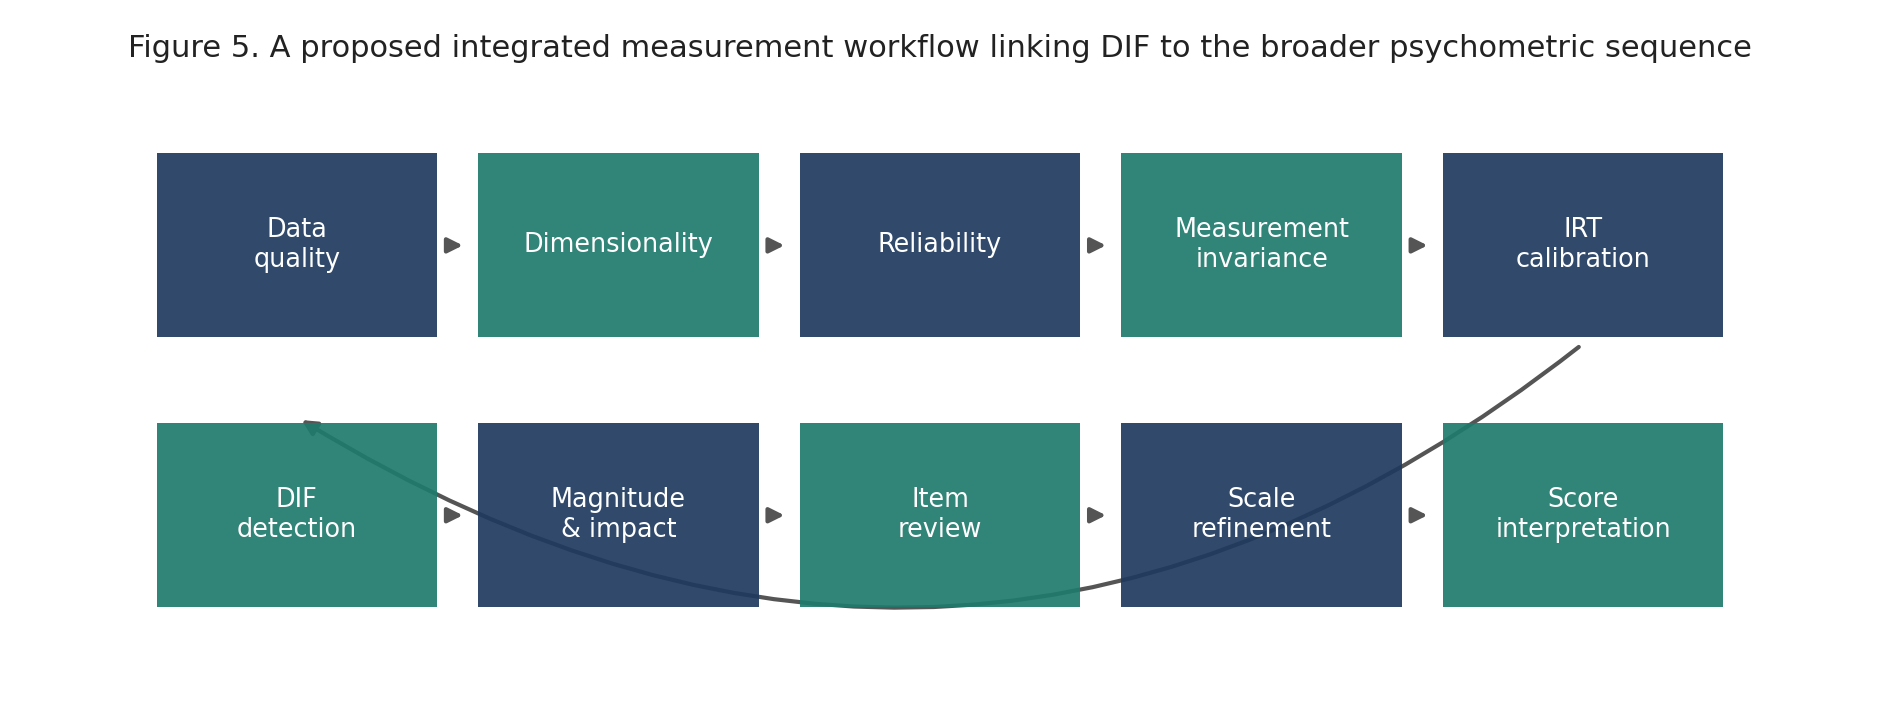
Figure 5. An integrated measurement workflow situating DIF detection within the broader sequence of psychometric evaluation, from data quality checks through to score interpretation.
A well-designed automated report generated from this workflow might note how many items showed statistically detectable DIF, how many of those exceeded a chosen practical-significance threshold, whether flagged items functioned differently across only part of the trait continuum, and whether content review was recommended before the instrument was used for direct cross-group comparisons. This style of reporting communicates both statistical and substantive evidence in a single coherent narrative, consistent with the reporting expectations set out in the Standards for Educational and Psychological Testing (AERA, APA & NCME, 2014; Oladunmoye, Oyedele, Enamudu, & Nakalema, 2024).
17. Ten Key Lessons
The discussion above can be distilled into ten practical lessons for applied researchers and test developers:
- DIF is fundamentally an item-level phenomenon, not a scale-level or group-level one.
- Different group scores do not, by themselves, constitute evidence of DIF.
- DIF requires conditioning on the underlying construct or an appropriate matching variable before any group comparison is meaningful.
- Uniform and non-uniform DIF represent distinct response patterns that call for different detection strategies.
- Item Response Theory provides a powerful and interpretable framework for modelling DIF.
- Confirmatory factor analysis based measurement invariance testing and IRT-based DIF detection are complementary rather than competing approaches.
- Statistical significance does not, on its own, establish practical importance.
- DIF magnitude and DIF impact are distinct quantities and both should be considered before any decision is made.
- A DIF finding should not automatically result in item deletion; a range of alternative responses exists.
- Fair and defensible measurement requires statistical evidence combined with substantive, cultural and contextual judgement.
18. Conclusion
Differential Item Functioning represents one of the most important bridges between classical psychometric validation and modern measurement fairness. An instrument can demonstrate high reliability and a well-fitting factor structure and yet still contain individual items that function differently across the populations in which it is used. This is why DIF should be understood not as a stand-alone statistical test but as one stage within the broader psychometric sequence running from construct definition through reliability, validity, dimensionality and measurement invariance to item-level analysis. Analysis should also move beyond the narrow question of whether a given effect was statistically significant: the more consequential questions are how large the DIF is, in which direction it operates, whether it has a meaningful impact on scores, what substantive explanation might account for the difference, and whether the item requires revision, removal, explicit modelling, or simply documentation.
For applied psychometric practice, DIF should be treated as a major component of an integrated measurement fairness workflow rather than as an isolated statistical procedure, connecting measurement invariance testing, item response modelling, DIF and Differential Test Functioning analysis, cultural adaptation procedures and, increasingly, computerised adaptive testing within a single coherent pipeline. The ultimate objective of this integration is not merely to flag statistically unusual items, but to ensure that psychological and educational measurements provide comparable, interpretable and defensible information across the populations in which they are used.
Recommended Citation
Oladunmoye, E. O. (2026). Differential item functioning: Detecting hidden item bias in psychological and educational measurement. PsychtrixWeb Research Notes, 010. Psychtrix Initiative Limited.
References
- American Educational Research Association, American Psychological Association, and National Council on Measurement in Education. (2014). Standards for educational and psychological testing. American Educational Research Association.
- Bjorner, J. B., Kosinski, M., and Ware, J. E., Jr. (2003). Calibration of an item pool for assessing the burden of headaches: An application of item response theory to the Headache Impact Test (HIT). Quality of Life Research, 12(8), 913 to 933.
- Crane, P. K., Gibbons, L. E., Ocepek-Welikson, K., Cook, K., Cella, D., Narasimhalu, K., Hays, R. D., and Teresi, J. A. (2007). A comparison of three sets of criteria for determining the presence of differential item functioning using ordinal logistic regression. Quality of Life Research, 16(Suppl. 1), 69 to 84.
- Hambleton, R. K., and Jones, R. W. (1993). Comparison of classical test theory and item response theory and their applications to test development. Educational Measurement: Issues and Practice, 12(3), 38 to 47.
- Holland, P. W., and Thayer, D. T. (1988). Differential item performance and the Mantel-Haenszel procedure. In H. Wainer and H. I. Braun (Eds.), Test validity (pp. 129 to 145). Lawrence Erlbaum Associates.
- Jones, R. N. (2019). Differential item functioning and its relevance to epidemiology. Current Epidemiology Reports, 6, 174 to 183.
- Kleinman, M., and Teresi, J. A. (2016). Differential item functioning magnitude and impact measures from item response theory models. Psychological Test and Assessment Modeling, 58(1), 79 to 98.
- Magis, D., Beland, S., Tuerlinckx, F., and De Boeck, P. (2010). A general framework and an R package for the detection of dichotomous differential item functioning. Behavior Research Methods, 42, 847 to 862.
- Mellenbergh, G. J. (1989). Item bias and item response theory. International Journal of Educational Research, 13(2), 127 to 143.
- Millsap, R. E. (2011). Statistical approaches to measurement invariance. Routledge.
- Swaminathan, H., and Rogers, H. J. (1990). Detecting differential item functioning using logistic regression procedures. Journal of Educational Measurement, 27(4), 361 to 370.
- Teresi, J. A., Ocepek-Welikson, K., Kleinman, M., Eimicke, J. P., Crane, P. K., Jones, R. N., Lai, J. S., Choi, S. W., and Cook, K. F. (2009). Evaluating measurement equivalence using differential item functioning in patient-reported outcome measures. Quality of Life Research, 18, 45 to 57.
- Thissen, D., and Steinberg, L. (1988). Data analysis using item response theory. Psychological Bulletin, 104(3), 468 to 477.
- Zumbo, B. D. (1999). A handbook on the theory and methods of differential item functioning (DIF): Logistic regression modeling as a unitary framework for binary and Likert-type (ordinal) item scores. Directorate of Human Resources Research and Evaluation, Department of National Defense.
- Oladunmoye, E. O., (2015). Development and validation of social provision scale on first year undergraduate psychological adjustment. Journal of Education and Practice, 6 (28), 78-90.
- Oladunmoye, E.O., Enamudu, G.P., Sa'ad, M.T. (2024). A Differential Item Functioning estimate of WAEC Mathematics test form based on gender and age among secondary school students. ISAR Journal of Multidisciplinary Research and Studies, 2(5), 15-21.
- Oladunmoye, E. O., Muhammad T. S., (2024). Development and Validation of Multiple Intelligence Test among emerging adults in the United Kingdom. ISAR Journal of Arts, Humanities and Social Sciences, 2(4), 18-24.
- Oladunmoye, E.O., Agbor, E.C., Olabisi, O.L., and Oyadeyi, J.B., (2024). Estimating measurement invariance on emotional intelligence scale across gender and age among undergraduates in Nigeria. Thinking Skills and Creativity Journal. 7(1),50-60
- Oladunmoye, E.O., Oyedele, O. Leah, Enamudu, G.P., and Faith, Nakalema, (2024). Assessing Psychometric Tools in Online Education: Effectiveness and Obstacles in Virtual Learning Assessments. ISAR Journal of Arts, Humanities and Social Sciences, 2(12), 8-13.
- Oladunmoye E.O (2025). Ultra-short scales in employee assessment: balancing efficiency and accuracy. Journal of Applied Sciences, Information and Computing.6(2),103-108.
Suggested citation
PhD, E. O. O. (2026). Differential Item Functioning. PsychtrixWeb Research Note, 011. Psychtrix Initiative Limited. https://www.psychtrixweb.online/research-notes/011-abstract-6Discuss this Research Note
Scholarly comments are welcome from anyone — no account required. Contributions are moderated before they appear.
No comments yet. Start the scholarly discussion below.