
Measurement Invariance
How to Know Whether a Psychological Scale Measures the Same Construct Across Groups
Abstract
Psychological researchers routinely compare scores across groups defined by sex, age, educational level, culture, geographical location, clinical status, or other characteristics. Meaningful comparison, however, requires more than demonstrating that a questionnaire has acceptable reliability within each group considered separately. Researchers must also establish that the instrument measures the underlying construct in sufficiently equivalent ways across the groups being compared. This requirement is addressed through measurement invariance testing, most commonly implemented within a multiple-group confirmatory factor analysis (MGCFA) framework. This research note provides an extended treatment of measurement invariance as a foundational component of contemporary psychometric validation. It introduces the major levels of invariance, namely configural, metric, scalar, and strict invariance, and clarifies the substantive conclusions that are justified at each level. The note also discusses partial invariance, longitudinal invariance, cross-cultural assessment, categorical indicators, the behaviour of model-fit indices under equality constraints, and the limitations of relying mechanically on conventional cutoff values such as a change in the comparative fit index of .01. Worked numerical illustrations, comparative tables, and illustrative charts are used throughout to make the statistical logic concrete. The note further considers how a psychometric analysis platform, referred to here as PsychtrixWeb, might operationalise measurement invariance through an integrated multiple-group CFA environment that evaluates competing models, flags potentially noninvariant items, produces publication-ready tables, and connects measurement invariance with differential item functioning, cultural adaptation, and latent mean comparison. The broader argument advanced throughout is that researchers should not ask merely whether two groups have different observed scores. They should first determine whether the measurement instrument provides a sufficiently comparable representation of the construct within those groups, because the answer to the second question conditions the interpretability of the first.
1. Introduction
Imagine a researcher administers a depression scale to two samples of university students, one comprising 500 students in Uganda and the other comprising 500 students in Nigeria. Suppose the observed means are as follows.
The researcher concludes that students in Uganda report higher depression than students in Nigeria. This is a natural inference from the raw numbers, but it rests on an assumption that is rarely stated explicitly: that the scale measures depression in sufficiently equivalent ways in the two populations. If an item carries a different meaning, elicits a different response process, loads differently onto the underlying factor, or has a different response threshold across the two groups, then part of the observed difference may reflect differences in measurement rather than differences in the underlying construct (Oladunmoye, Agbor, Olabisi, & Oyadeyi, 2024).
M(Uganda) = 31.4 M(Nigeria) = 27.8
This is the central problem addressed by measurement invariance. Measurement invariance concerns whether a construct has sufficiently equivalent measurement properties across groups, or across time when the same people are assessed repeatedly. When invariance does not hold, comparisons of the construct can become difficult to interpret or, in the worst case, actively misleading. The purpose of this research note is to set out the logic of measurement invariance testing in enough depth that a working researcher can plan, execute, and report an invariance analysis with confidence, and can recognise when a proposed group comparison needs this scaffolding in the first place (Oladunmoye, Enamudu, & Ogbu, 2024).
2. Why Measurement Invariance Matters
Psychological researchers compare groups constantly. Typical examples include comparisons between men and women, younger and older adults, undergraduate and postgraduate students, urban and rural populations, clinical and nonclinical samples, different countries such as Uganda and Kenya, different continents such as Africa and Europe, pre-intervention and post-intervention assessments, and different ethnic or cultural groups.
Every one of these comparisons rests on an implicit assumption, namely that the scores being compared carry comparable meaning. The fundamental logical relationship can be stated as follows.
Meaningful group comparison => sufficient measurement equivalence
Put differently, before comparing people we must first establish that the measurement system used to describe them is itself comparable across the groups in question. This is not a pedantic statistical nicety. If two groups differ in mean scores purely because one group interprets an item differently, then a substantive claim about the underlying psychological construct, such as depression, self-esteem, or job satisfaction, is not actually supported by the data. The comparison has quietly become a comparison of measurement artefacts rather than of the construct the researcher set out to study.
3. Reliability Within Groups Is Not Sufficient
A common but mistaken shortcut is to treat within-group reliability as evidence of cross-group equivalence. Suppose a researcher reports the following internal consistency estimates.
Group | Cronbach's alpha |
|---|---|
Group A | .89 |
Group B | .87 |
Table 1. Illustrative within-group reliability coefficients.
A researcher might conclude that the instrument is reliable in both groups, and this may well be true. It does not, however, establish measurement invariance. The scale could still have different factor loadings, different intercepts or thresholds, different residual variances, or different patterns of item functioning across the two groups, all while producing similar alpha coefficients within each group separately. Reliability describes the internal consistency of items within a group; invariance describes whether the measurement parameters that link items to the latent construct are equal across groups. These are logically distinct properties.
Reliability equivalence is not the same as measurement invariance
A scale can therefore be highly reliable in every group under study and still fail to measure the underlying construct in an equivalent way. This is precisely the situation that measurement invariance testing is designed to detect.
4. Measurement Invariance as a Confirmatory Factor Analysis Problem
Measurement invariance is most commonly examined using multiple-group confirmatory factor analysis. Consider the standard linear factor model for a continuous item response.
X(i,g) = v(i) + lambda(i) F(g) + epsilon(i,g)
In this expression, X(i,g) denotes the observed response to item i in group g, v(i) is the item intercept, lambda(i) is the factor loading linking item i to the latent factor, F(g) is the latent factor score for group g, and epsilon(i,g) is the item-specific residual. Measurement invariance asks whether the relevant parameters, namely the intercepts, loadings, and residual variances, can reasonably be treated as equal across groups. The analysis therefore proceeds from a relatively unrestricted baseline model towards a sequence of increasingly constrained models, examining at each step whether the added constraints produce an unacceptable deterioration in model fit (Oladunmoye, & Muhammad, 2024; Oladunmoye, Enamudu, & Sa'ad, 2024).
5. The Four Levels of Measurement Invariance
The conventional hierarchy used in applied measurement-invariance research comprises four nested levels: configural, metric, scalar, and strict invariance. Each level retains the constraints of the level before it and adds a further equality constraint, so the levels represent progressively stronger assumptions about equivalence. Most applied studies report at least configural, metric, and scalar testing; strict invariance is tested less often because it is a demanding requirement that is not necessary for every research question.
Configural invariance
Configural invariance is the starting point. The question is whether the groups share the same basic factor structure, for example whether a first factor is indicated by items X1 to X4 and a second factor by items X5 to X8 in every group.
F1 -> X1, X2, X3, X4 F2 -> X5, X6, X7, X8
Factor loadings are allowed to differ freely across groups at this stage. If configural invariance is supported, the same general construct structure can represent the data in every group, but this alone does not establish that groups interpret individual items in the same quantitative way.
Metric (weak) invariance
Metric invariance constrains the factor loadings to equality across groups.
lambda(i, A) = lambda(i, B)
The question is whether each item relates to the latent construct with the same strength in every group. If metric invariance is supported, relationships involving the latent construct, such as correlations or regression slopes, can be meaningfully compared across groups.
Scalar (strong) invariance
Scalar invariance additionally constrains the item intercepts, or the corresponding thresholds for ordinal items, to equality.
v(i, A) = v(i, B)
This level asks whether people with the same standing on the latent construct would be expected to produce the same observed item response regardless of group membership. Without sufficient scalar invariance, an observed mean difference may reflect differing response tendencies rather than a genuine difference in the construct, which is why scalar invariance is the level most directly relevant to comparing latent means, arguably the most common goal that motivates invariance testing in the first place.
Strict invariance
Strict invariance further constrains the residual variances of the indicators to equality.
theta(i, A) = theta(i, B)
This asks whether item-specific measurement error is equivalent across groups. Strict invariance is considerably more demanding than the levels before it and is not always necessary; it becomes most relevant when researchers want to make stronger claims about observed composite scores and measurement precision, for example when treating raw sum scores as interchangeable across groups.
Level | Parameters constrained equal | What becomes interpretable |
|---|---|---|
Configural | None (same pattern of free and fixed loadings) | Same general factor structure is plausible across groups |
Metric | Factor loadings | Latent relationships (correlations, slopes) can be compared |
Scalar | Loadings and intercepts / thresholds | Latent means can be meaningfully compared |
Strict | Loadings, intercepts / thresholds, residual variances | Stronger observed-score comparability |
Table 2. The conventional four-level measurement-invariance hierarchy and what each level licenses.
This hierarchy is a useful organising device, but it is not a checklist to be worked through mechanically. The substantive research question determines which level is actually needed: a researcher interested only in whether a construct's correlates are similar across groups may require no more than metric invariance, whereas a researcher who wants to claim that one group scores higher than another on the construct itself needs scalar invariance at a minimum (Oladunmoye, Enamudu, & Sa'ad, 2024).
6. Measurement Invariance Is Not All-or-Nothing: Partial Invariance
One of the most important developments in modern measurement-invariance research is the recognition that full invariance may fail even when meaningful partial invariance remains possible. Suppose a twenty-item scale contains nineteen approximately invariant items and a single noninvariant item. It would be inappropriate to conclude that the entire scale is invalid on this basis alone. Instead, researchers can investigate partial measurement invariance, in which the equality constraint is released for the offending item or items while retained for the remainder of the scale.
Putnick and Bornstein's methodological review of the developmental and psychological literature found that partial invariance was reported in a substantial proportion of published invariance studies, illustrating that this is a routine empirical situation rather than an unusual failure case (Putnick & Bornstein, 2016).
Partial metric invariance
Suppose a single item, Item 7, shows a loading that differs meaningfully across groups while the remaining loadings are sufficiently comparable.
lambda(7, A) is not equal to lambda(7, B)
The researcher might free the loading of Item 7 while retaining the equality constraint for every other item, producing a partial metric model. The question then becomes whether there remains sufficient invariant measurement information to support the intended comparison. This is a substantive methodological judgement that draws on theory and item content, not simply a pass or fail decision generated automatically by software.
Partial scalar invariance
A parallel situation can arise at the level of intercepts. Suppose Item 7 also has a different intercept across groups.
v(7, A) is not equal to v(7, B)
The item may be released from the intercept equality constraint while the remaining items retain it. The researcher can then examine whether the remaining invariant items provide sufficient identification to support latent mean comparisons. Contemporary methodological work continues to refine methods for identifying noninvariant items and implementing partial invariance in a principled way, rather than treating the failure of full invariance as the end of the analysis.
7. Interpreting Model Fit in Invariance Testing
The trouble with fixed fit-index cutoffs
Researchers frequently encounter decision rules such as a change in the comparative fit index of no more than .01, or a change in the root mean square error of approximation of no more than .015, when moving from one nested invariance model to the next. These heuristics, associated with the influential work of Cheung and Rensvold (2002), can be useful starting points, but should not be treated as universal laws applying identically to every dataset. Contemporary research shows that the behaviour of fit-index differences depends on model complexity, sample characteristics, measurement quality, loading magnitude, the number of groups compared, and other data conditions, so a fixed cutoff derived from one set of simulation conditions may not generalise to a study with different characteristics (Oladunmoye & Muhammad, 2024).
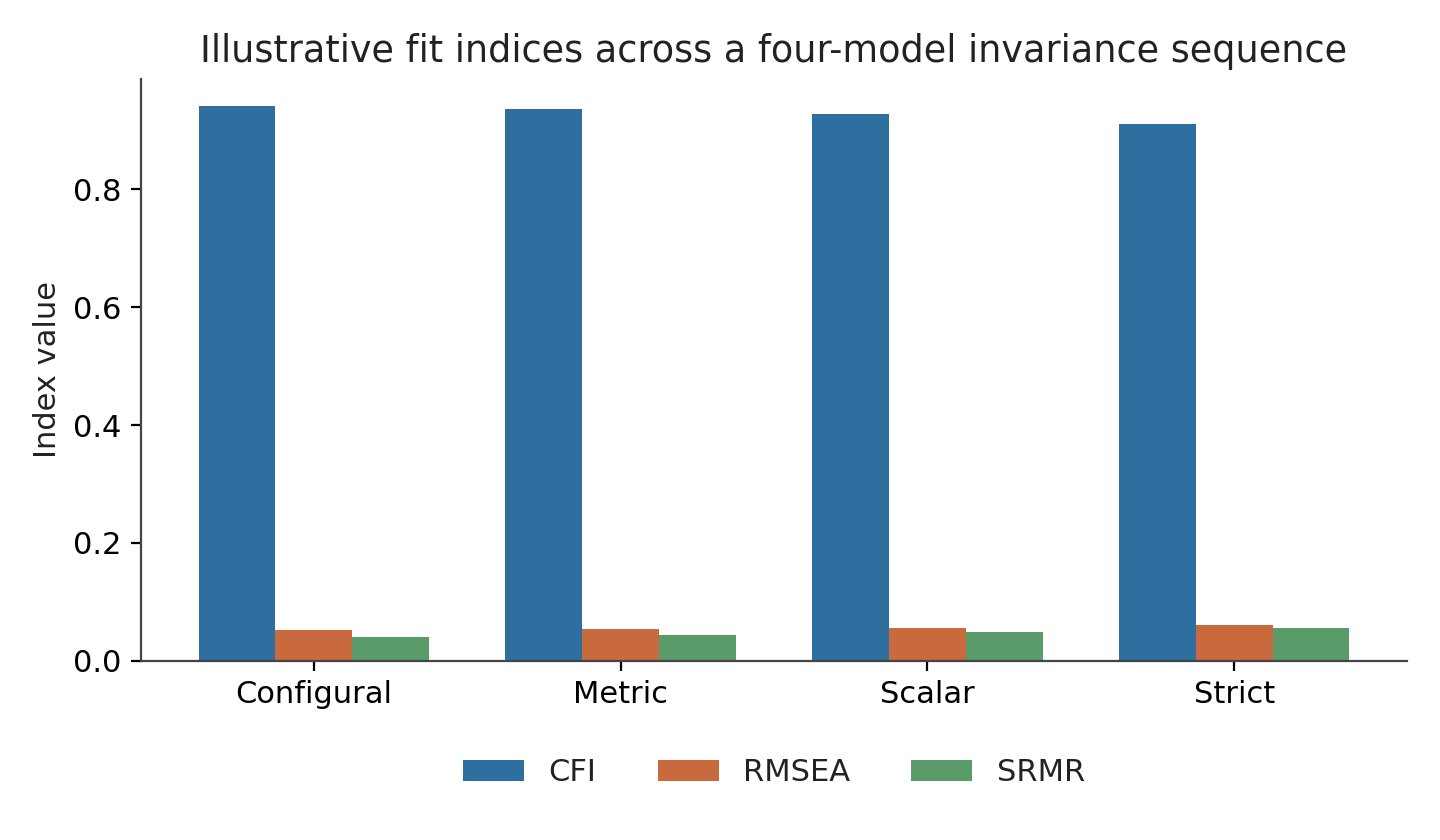
Figure 1. Illustrative fit indices (CFI, RMSEA, and SRMR) across a four-model invariance sequence.
Figure 1 shows a typical pattern in which fit deteriorates gradually as constraints accumulate from the configural model through to the strict model. The small change in CFI from configural to metric here is consistent with a conclusion of metric invariance under the conventional heuristic, while the larger deterioration at the strict level illustrates why strict invariance is tested less often and is not always achieved even when the earlier levels hold comfortably (Oladunmoye, 2015).
Chi-square difference testing and sample size
Researchers sometimes rely on the chi-square difference test as the sole criterion for deciding whether an equality constraint is tenable. This is problematic because chi-square is sensitive to sample size: with a large combined sample, even trivial differences become statistically significant, while with a small sample, meaningful differences may fail to reach significance simply for lack of power.
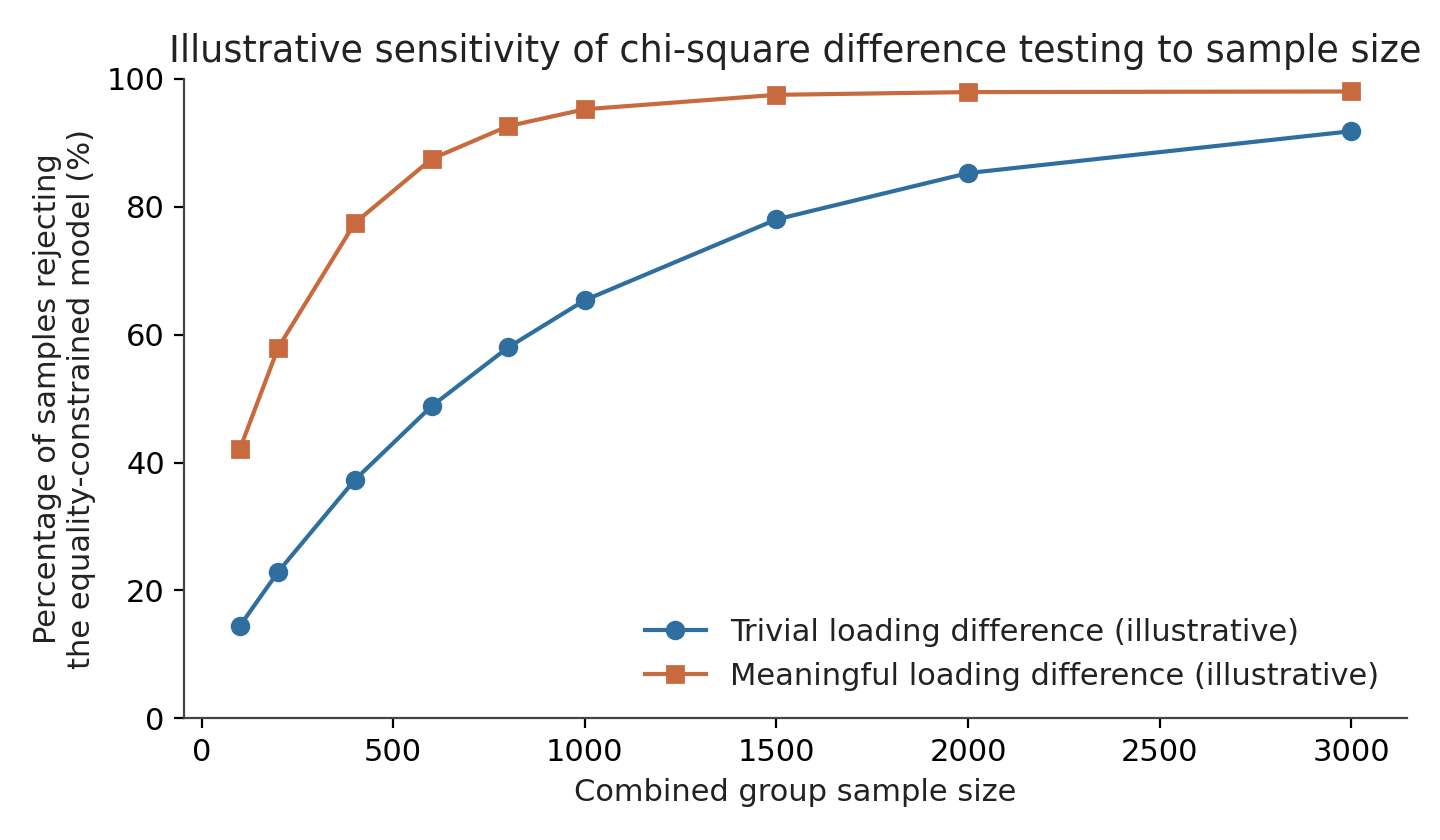
Figure 2. Illustrative sensitivity of chi-square difference testing to combined sample size, contrasting a trivial loading difference with a meaningful one.
Chen's work, and subsequent literature, therefore encouraged researchers to consider changes in alternative fit indices alongside statistical testing rather than relying mechanically on the chi-square difference test alone. More recent work questions the wisdom of any fixed cutoff, arguing instead for context-sensitive evaluation.
Measurement quality and the behaviour of fit indices
The quality of the underlying measurement model also has a substantial bearing on how fit indices behave under invariance constraints. Consider a model with strong loadings of .85, .83, .81, and .79 against one with weak loadings of .31, .42, .48, and .55: the behaviour of fit-index changes under equality constraints can differ substantially between these situations, even holding the true degree of noninvariance constant.
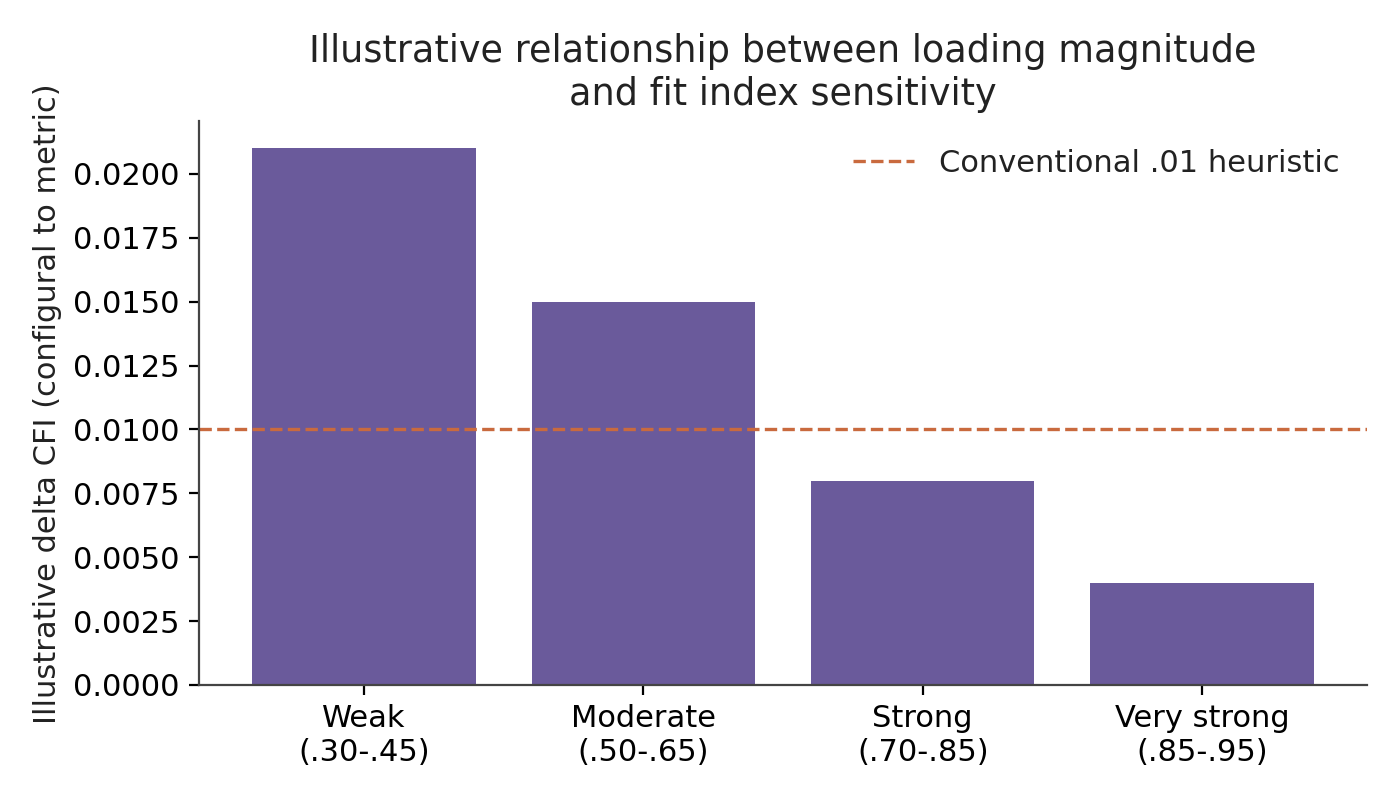
Figure 3. Illustrative relationship between loading magnitude and the sensitivity of the change in comparative fit index to equality constraints.
Simulation research confirms that measurement quality, including loading magnitude, affects the interpretation of fit-index differences: weakly loading items tend to produce larger, more erratic changes under constraint than strongly loading items, so invariance criteria should always be interpreted in the context of the measurement model's quality rather than applied as context-free thresholds.
8. Cross-Cultural Measurement and Adaptation
Measurement invariance becomes particularly consequential in cross-cultural research. Even when a translation of a scale is linguistically accurate, cultural differences may influence item interpretation, response style, social desirability, conceptual meaning, item relevance, response thresholds, and factor loadings.
Translation is not the same as measurement equivalence
A translated instrument therefore requires empirical evaluation before it can be assumed to measure the same construct as the original. A rigorous cross-cultural adaptation process typically follows the sequence below, creating a continuum from linguistic equivalence, through structural equivalence, to measurement equivalence.
- Conceptual analysis of the construct in the target culture
- Forward translation
- Back translation
- Expert review
- Cognitive interviewing with target-population respondents
- Pilot testing
- Exploratory factor analysis, where appropriate
- Confirmatory factor analysis
- Measurement invariance testing
- Differential item functioning analysis
Linguistic equivalence -> Structural equivalence -> Measurement equivalence
A future version of PsychtrixWeb could integrate these steps into a dedicated cultural adaptation module, guiding researchers from translation through to a fully documented invariance analysis without switching between separate tools at each stage.
9. Special Data Situations: Longitudinal Designs and Ordinal Items
Longitudinal measurement invariance and intervention research
Measurement invariance is not limited to comparisons between different people. It can equally be evaluated across time within the same sample, a situation described as longitudinal or over-time invariance. Consider a researcher who administers a resilience scale before an intervention, immediately after it, and again three months later, wishing to draw a conclusion of the following form.
Delta F = F(post) - F(pre)
Before this conclusion can be drawn safely, the researcher must ask whether the scale measures resilience equivalently on each occasion. If the meaning of the items changes, perhaps because participants reinterpret them after the intervention, an apparent change in observed scores may partly, or even entirely, reflect measurement change rather than true change in the construct. Suppose a pre-test mean of 42 rises to a post-test mean of 55: if the intervention changes how participants interpret the items, this observed change may not fully represent true latent change. This concern makes longitudinal invariance particularly important in psychotherapy research, educational interventions, clinical trials, and programme evaluation, where a change score is often the primary outcome of interest.
Categorical and ordinal indicators
Most psychological questionnaires use Likert-type items with ordered categories rather than continuous response scales. In such situations, the intercept parameter of the continuous-indicator model is conceptually replaced by a set of thresholds, one fewer than the number of response categories, governing the probability of crossing from one category to the next as the latent trait increases. The choice of estimator also matters: researchers typically need a categorical confirmatory factor analysis framework, a robust weighted least squares estimator, polychoric correlations, and threshold equality constraints analogous to intercept constraints for continuous data. Research comparing estimators, including Sass, Schmitt, and Marsh's work, has shown that handling ordered categorical indicators appropriately, rather than treating them as continuous, materially affects which level of invariance is supported. Wu and Estabrook's identification work is also relevant, since different invariance levels require different identification constraints for ordinal items, and getting this wrong can produce misleading conclusions about whether metric or scalar invariance holds.
10. From Differential Item Functioning to Latent Mean Comparison
Measurement invariance and differential item functioning
Measurement invariance and differential item functioning, commonly abbreviated as DIF, are closely related but are not identical concepts. Measurement invariance is generally evaluated at the level of the latent variable model as a whole, using multiple-group confirmatory factor analysis. Differential item functioning is usually evaluated at the level of the individual item, often using item response theory methods.
MGCFA -> scale-level equivalence IRT-DIF -> item-level functioning
A sophisticated workflow should let researchers move fluidly between the two, using scale-level invariance testing to flag a problem and item-level DIF analysis to localise it. Suppose a twenty-item stress scale is subjected to MGCFA and the results suggest scalar noninvariance; a platform such as PsychtrixWeb could flag this and the researcher could proceed to item-level analysis to identify which items are responsible.
Item | DIF evidence |
|---|---|
Item 1 | None |
Item 2 | None |
Item 3 | Moderate |
Item 4 | None |
Item 5 | Strong |
... | ... |
Table 4. Illustrative item-level differential item functioning results following a scale-level finding of scalar noninvariance.
On this basis, the researcher can investigate whether Items 3 and 5 are functioning differently across groups, and decide whether to revise, remove, or flag those items in future use of the instrument.
Latent mean comparison and structural models
When scalar invariance is supported, researchers can compare latent means using an appropriate reference group whose mean is typically fixed to zero for identification purposes.
M(Uganda) = 0 (reference) M(Kenya) = 0.37
The interpretation is that the Kenyan group has a latent factor mean approximately 0.37 standard units above the reference group, subject to the model specification and identification scheme used, which is considerably more theoretically defensible than comparing raw total scores when the research question concerns the latent construct itself. A related application arises when a researcher wants to compare a structural path, for example the relationship between social support and depressive symptoms, across two groups. If the measurement model operates differently across groups, the structural relationship may not be directly comparable, because any observed difference could be confounded with differences in measurement. This is why measurement invariance testing should ordinarily precede substantive multi-group comparisons within a structural equation model.
Measurement -> Equivalence -> Structural comparison
This ordering, and not the reverse sequence of comparing groups first and asking measurement questions later, is what a defensible workflow requires.
11. Beyond Two Groups: Alignment and Approximate Invariance
Many textbook examples compare exactly two groups, but applied researchers increasingly compare several countries, ethnic groups, age categories, or educational groups at once, and testing complexity increases rapidly as group count grows. Traditional equality-constrained approaches must therefore extend beyond the two-group case. Cheung, Hu, and Zubielevitch's work introducing the MEI package in R is directly relevant, developing systematic procedures, including pairwise rotation of the reference item and a list-and-delete method, for identifying invariant items and clusters of invariant groups across cross-group, longitudinal, congruence, and multilevel studies.
When many groups are compared, strict equality constraints everywhere can become unrealistic, since it is increasingly unlikely every parameter will be exactly equal across a large number of populations. This has motivated approximate invariance and alignment optimisation methods, particularly relevant when comparing latent constructs across many cultural or national groups while permitting a limited, explicitly modelled amount of parameter variation. Kusano, Napier, and Jost's 2025 critique adds an important caution: strict invariance standards, developed originally for high-stakes individual selection and fairness testing, are not always an appropriate benchmark for comparative research in social and cultural psychology, and reliance on a nomological network of theoretically expected correlates can sometimes provide a more defensible basis for cross-group comparison than insisting on partial or full invariance. This remains an actively debated direction for cross-cultural measurement practice, including within a platform such as PsychtrixWeb.
12. Reporting Standards and Common Mistakes
A methodologically strong measurement-invariance article should report the groups compared, sample sizes, the confirmatory factor analysis model, estimator and identification method, the fit of each nested model, fit-index changes, any noninvariant parameters identified, decisions on partial invariance, and the substantive implications drawn. Putnick and Bornstein's review found considerable variation in how measurement invariance was reported across the published literature, reinforcing the need for clearer, more standardised practice.
An example of concise APA-style reporting
A concise methods report might read as follows: multiple-group confirmatory factor analysis examined measurement invariance across the two study groups; the configural model showed acceptable fit, supporting the hypothesised structure in both groups; equality constraints were then imposed on loadings (metric invariance) and intercepts (scalar invariance); fit changes were evaluated using multiple indices rather than the chi-square difference test alone; the results supported metric and scalar invariance, permitting subsequent comparison of latent means.
Ten common mistakes
- Comparing group means without first testing measurement equivalence
- Assuming that equal Cronbach's alpha coefficients imply invariance
- Relying solely on chi-square difference testing
- Treating a change in CFI of .01 as a universal law rather than a heuristic
- Deleting noninvariant items automatically without theoretical justification
- Ignoring the theoretical meaning of an item when freeing its parameters
- Treating partial invariance as if it were complete equivalence
- Ignoring the ordinal character of Likert-type response data
- Testing invariance on a poorly fitting baseline confirmatory factor model
- Reporting that invariance was established without specifying which level
13. A PsychtrixWeb Workflow for Measurement Invariance
PsychtrixWeb can transform measurement-invariance analysis from a manual, script-driven exercise into a guided workflow accessible to researchers confident in psychometric theory but less confident in structural equation modelling syntax. A researcher would upload a dataset, specify a group variable such as gender or country and the intended confirmatory factor analysis model, then select a measurement invariance option; the platform would automatically estimate the configural, metric, scalar, and strict models in sequence and present the results as in Table 5.
Model | CFI | RMSEA | SRMR | Delta CFI | Decision |
|---|---|---|---|---|---|
Configural | .941 | .052 | .041 | - | Baseline |
Metric | .937 | .053 | .044 | -.004 | Supported |
Scalar | .928 | .055 | .048 | -.009 | Supported |
Strict | .911 | .061 | .056 | -.017 | Review |
Table 5. Illustrative PsychtrixWeb measurement invariance dashboard summary.
Intelligent interpretation and dynamic cutoffs
The software should not display a bare verdict such as strict invariance failed; it should explain why, for example noting that metric invariance is supported because the loading constraints produced only a small deterioration in fit, that scalar invariance is supported within the selected decision framework so latent mean comparisons are potentially defensible, and that strict invariance is not supported, which does not necessarily prevent comparison of latent means or structural relationships since its necessity depends on the analysis intended. An advanced version should also avoid a single hard-coded threshold: recent work proposes dynamic invariance cutoffs recognising that the distribution of fit-index changes depends on model and data characteristics, weighing conventional heuristics against the empirical changes observed, model complexity, loading strength, and sample characteristics before generating a reasoned recommendation.
Towards a fairness-oriented psychometric platform
A future PsychtrixWeb workflow could connect confirmatory factor analysis, reliability estimation, measurement invariance testing, differential item functioning, cultural adaptation support, and fairness diagnostics into a single evidence chain leading to a validated score interpretation, rather than disconnected procedures across separate tools. A scale that behaves differently across populations may produce systematically different interpretations of the same numerical score, so measurement invariance is a question of measurement fairness as much as statistical technique, closely connected to differential item functioning, cultural adaptation, and test bias.
14. Researcher Decision Framework and Ten Key Lessons
Before comparing groups on a psychological construct, a researcher can usefully work through a short sequence of questions.
- Does the factor structure hold in every group? This is addressed by configural invariance.
- Are the factor loadings sufficiently comparable across groups? This is addressed by metric invariance.
- Are the intercepts or thresholds sufficiently comparable across groups? This is addressed by scalar invariance.
- Are the residual variances comparable across groups, where this is substantively necessary? This is addressed by strict invariance.
- If full invariance fails, can a defensible partial invariance model be established?
- Are particular items functioning differently across groups? This is addressed by differential item functioning analysis.
This sequence creates a coherent psychometric decision pathway that moves from the most general question, whether the same construct is being measured at all, to increasingly specific questions about which parameters, and ultimately which items, may be responsible for any noninvariance detected.
Ten key lessons
- A reliable scale is not necessarily an invariant scale.
- Measurement invariance is essential whenever scores are compared across groups or across time.
- Configural invariance concerns the factor structure of the instrument.
- Metric invariance concerns the equality of factor loadings.
- Scalar invariance concerns the equality of intercepts or thresholds.
- Strict invariance concerns the equality of residual variances.
- Partial invariance can provide a defensible solution when full invariance fails.
- Chi-square difference testing should not be the sole decision criterion.
- Fixed fit-index cutoffs should be treated as guidelines rather than universal laws.
- Measurement invariance should ordinarily precede the substantive interpretation of most cross-group comparisons.
15. Conclusion
Psychological measurement does not end once an instrument shows acceptable reliability or a confirmatory factor analysis produces a satisfactory fit within a single sample. The next question is whether the instrument measures the construct equivalently for the populations in which scores will be compared. Measurement invariance provides a structured framework for answering that question, set out here with worked illustrations, comparative tables, and figures for direct application to an applied research problem.
The progression from configural, through metric and scalar, to strict invariance represents progressively stronger claims about measurement equivalence.
Configural -> Metric -> Scalar -> Strict
These levels should not be treated as a mechanical sequence of statistical gates. Their interpretation depends on the research purpose, the quality and specification of the measurement model, the structure of the groups compared, the response scale used, and the substantive context of the study. Contemporary methodological research increasingly cautions against universal fit-index cutoffs and emphasises context-sensitive evaluation instead.
For PsychtrixWeb, measurement invariance should become more than a single MGCFA button. It can become an integrated measurement equivalence and fairness engine, connecting confirmatory factor analysis, invariance testing, partial invariance procedures, differential item functioning, cultural adaptation support, and fairness diagnostics within one coherent workflow.
CFA + Measurement Invariance + Partial Invariance + DIF + Cultural Adaptation + Fairness Diagnostics
Such an architecture would let researchers not merely ask whether two groups have different scores, but determine whether those differences are properly interpretable as differences in the underlying psychological construct rather than artefacts of the measurement process itself. That distinction, simple to state but demanding to establish, is fundamental to rigorous psychometric science.
Recommended citation
Oladunmoye, E. O. (2026). Measurement invariance: How to know whether a psychological scale measures the same construct across groups (Extended ed.). PsychtrixWeb Research Notes, 009. Psychtrix Initiative Limited.
References
Chen, F. F. (2007). Sensitivity of goodness of fit indexes to lack of measurement invariance. Structural Equation Modeling, 14(3), 464 to 504. https://doi.org/10.1080/10705510701301834
Cheung, G. W., & Rensvold, R. B. (2002). Evaluating goodness-of-fit indexes for testing measurement invariance. Structural Equation Modeling, 9(2), 233 to 255. https://doi.org/10.1207/S15328007SEM0902_5
Cheung, G. W., Hu, C., & Zubielevitch, E. (2026). Assessing partial measurement invariance in cross-group, longitudinal, congruence, and multilevel organizational studies: Introducing the MEI package in R. Organizational Research Methods. Advance online publication. https://doi.org/10.1177/10944281261449198
Kusano, K., Napier, J. L., & Jost, J. T. (2025). The mismeasure of culture: Why measurement invariance is rarely appropriate for comparative research in psychology. Personality and Social Psychology Bulletin. Advance online publication. https://doi.org/10.1177/01461672251341402
Meredith, W. (1993). Measurement invariance, factor analysis and factorial invariance. Psychometrika, 58(4), 525 to 543. https://doi.org/10.1007/BF02294825
Oladunmoye, E. O. (2026b). From Questionnaire to Validated Instrument: A Complete Psychometric Analysis Workflow Using PsychtrixWeb. PsychtrixWeb Research Note, 006. Psychtrix Initiative Limited. https://www.psychtrixweb.online/research-notes/006-1-introduction-2
Oladunmoye, E. O., (2015). Development and validation of social provision scale on first year undergraduate psychological adjustment. Journal of Education and Practice, 6 (28), 78-90.
Oladunmoye, E. O., Muhammad T. S., (2024). Development and Validation of Multiple Intelligence Test among emerging adults in the United Kingdom. ISAR Journal of Arts, Humanities and Social Sciences, 2(4), 18-24.
Oladunmoye, E.O., Agbor, E.C., Olabisi, O.L., and Oyadeyi, J.B., (2024). Estimating measurement invariance on emotional intelligence scale across gender and age among undergraduates in Nigeria. Thinking Skills and Creativity Journal. 7(1),50-60
Oladunmoye, E.O., Enamudu, G.P., Ogbu, F. (2024). Comparison of estimate of linear and Equi-percentile CTT equating of WAEC Mathematics test forms 2022 and 2023. International Journal of Humanities Social Science and Management (IJHSSM), 4(3),544-552.
Oladunmoye, E.O., Enamudu, G.P., Sa'ad, M.T. (2024). A Differential Item Functioning estimate of WAEC Mathematics test form based on gender and age among secondary school students. ISAR Journal of Multidisciplinary Research and Studies, 2(5), 15-21.
Oladunmoye, E.O., Oyedele, O. Leah, Enamudu, G.P., and Faith, Nakalema, (2024). Assessing Psychometric Tools in Online Education: Effectiveness and Obstacles in Virtual Learning Assessments. ISAR Journal of Arts, Humanities and Social Sciences, 2(12), 8-13.
Putnick, D. L., & Bornstein, M. H. (2016). Measurement invariance conventions and reporting: The state of the art and future directions for psychological research. Developmental Review, 41, 71 to 90. https://doi.org/10.1016/j.dr.2016.06.004
Sass, D. A., Schmitt, T. A., & Marsh, H. W. (2014). Evaluating model fit with ordered categorical data within a measurement invariance framework: A comparison of estimators. Structural Equation Modeling, 21(2), 167 to 180. https://doi.org/10.1080/10705511.2014.882658
Svetina, D., Rutkowski, L., & Rutkowski, D. (2020). Multiple-group invariance with categorical outcomes using updated guidelines: An illustration using Mplus and the lavaan/semTools packages. Structural Equation Modeling, 27(1), 111 to 130. https://doi.org/10.1080/10705511.2019.1602776
Vandenberg, R. J., & Lance, C. E. (2000). A review and synthesis of the measurement invariance literature: Suggestions, practices, and recommendations for organizational research. Organizational Research Methods, 3(1), 4 to 70. https://doi.org/10.1177/109442810031002
Wu, H., & Estabrook, R. (2016). Identification of confirmatory factor analysis models of different levels of invariance for ordered categorical outcomes. Psychometrika, 81, 1014 to 1045. https://doi.org/10.1007/s11336-016-9506-0
Suggested citation
PhD, E. O. O. (2026). Measurement Invariance. PsychtrixWeb Research Note, 010. Psychtrix Initiative Limited. https://www.psychtrixweb.online/research-notes/010-1-introduction-4Discuss this Research Note
Scholarly comments are welcome from anyone — no account required. Contributions are moderated before they appear.
No comments yet. Start the scholarly discussion below.