
How Many Factors Does a Psychological Scale Really Have?
A Practical Guide to Factor Retention in Exploratory Factor Analysis
Abstract
Determining the number of latent factors underlying a set of questionnaire items is one of the most consequential decisions a researcher makes in exploratory factor analysis (EFA). An incorrect factor retention decision can produce an over factored, under factored, or conceptually incoherent measurement model, with downstream consequences for reliability, validity, scoring, and substantive interpretation. Despite its importance, many applied researchers continue to rely heavily on simple heuristics such as the eigenvalue greater than one rule or unaided visual inspection of scree plots. This Research Note reviews contemporary approaches to factor retention, including the Kaiser criterion, the scree test, parallel analysis, the minimum average partial correlation procedure, comparison data methods, the Hull method, and exploratory graph analysis. Particular attention is given to the principle that no single retention method is optimal under every data condition. Recent simulation and methodological literature indicates that the accuracy of factor retention methods varies with sample size, factor correlations, the number of indicators per factor, factor strength, missingness, and the underlying population structure (Auerswald & Moshagen, 2019; Goretzko, 2025). The Note proposes a practical, multi evidence decision framework for applied researchers and describes an implementation model for the PsychtrixWeb platform in which factor retention is treated as a converging body of psychometric evidence rather than a single automatic statistical command. The central recommendation is that researchers should combine empirical retention criteria with theoretical interpretability, item level evidence, and independent replication before finalising the dimensional structure of a scale. Keywords: factor retention, exploratory factor analysis, parallel analysis, eigenvalues, scree plot, dimensionality, psychometrics, scale development, latent factors, PsychtrixWeb
1. Introduction
One of the first questions researchers face after collecting questionnaire data is deceptively simple to ask and remarkably difficult to answer: how many factors are actually present in this instrument?
Consider a researcher who develops twenty four items intended to measure psychological resilience. The theoretical model initially proposes four dimensions: emotional recovery, adaptive coping, self regulation, and problem solving. The researcher conducts an EFA and obtains the following eigenvalues, in descending order:
7.82, 3.91, 2.10, 1.47, 1.12, 0.91, 0.73, ...
What should the researcher conclude? Should the scale be treated as having five factors because five eigenvalues exceed one? Four factors because theory proposes four? Three factors because the scree plot appears to level off after the third? Or some other number entirely, based on parallel analysis or another simulation based criterion?
This is not a trivial technical decision. The number of retained factors shapes item retention, scale scoring, subscale reliability, the specification of any later confirmatory factor analysis (CFA), measurement invariance testing, and the substantive interpretation of the construct itself.
Recent methodological work continues to describe factor retention as one of the most decisive, and one of the most difficult, decisions in the entire EFA workflow, and calls for a more thoughtful and evidence based use of retention criteria rather than reliance on simplistic heuristics (Goretzko, 2025). This Research Note sets out why that difficulty exists, surveys the principal retention methods available to applied researchers, and proposes a practical framework, including an implementation model for the PsychtrixWeb platform, for making and reporting defensible retention decisions.
2. What Does “Number of Factors” Mean?
A factor represents a latent source of covariance among a set of observed variables. Suppose four items, labelled X1 to X4, are strongly associated with one another because they each reflect an underlying construct that can be called F1, emotional recovery. Suppose a further four items, X5 to X8, reflect a distinct underlying construct, F2, adaptive coping.
The factor retention problem therefore asks a specific question: how many latent dimensions are needed to provide an adequate and interpretable representation of the observed pattern of item relationships? This is a different question from asking how many statistically significant components can be extracted from the correlation matrix. The distinction is fundamental to good psychometric practice. A component in principal component analysis (PCA) is a linear combination of the observed variables chosen to maximise explained variance; a common factor in EFA is a latent variable hypothesised to account for the shared covariance among indicators, net of unique and error variance. Conflating the two, treating PCA output as though it were equivalent to common factor EFA output, is itself a recognised source of retention error (Fabrigar, Wegener, MacCallum, & Strahan, 1999).
3. Under Factoring and Over Factoring
There are two major errors that a factor retention decision can produce.
Error type | Description | Typical consequence |
|---|---|---|
Under factoring | Too few factors are retained; a genuinely multidimensional construct is collapsed into fewer dimensions than actually exist. | Meaningful sub dimensions are obscured; items with distinct content are forced to share a factor; composite scores blend unrelated content. |
Over factoring | Too many factors are retained; random sampling variation, or a small cluster of similarly worded items, is interpreted as a substantive latent dimension. | Spurious factors with few strong indicators appear; reliability estimates for the spurious factor are unstable; theoretical interpretation becomes strained. |
Table 1. The two principal errors in factor retention.
Both errors can seriously damage construct interpretation, and the methodological literature is not unanimous about which is worse in every circumstance; some authors argue that under factoring is generally the more harmful of the two because it distorts the factor structure more broadly, causing items to cross load falsely onto factors that do not represent their content, whereas a modest degree of over factoring can sometimes be corrected relatively cleanly by dropping a weak, sparsely loaded factor (Fabrigar et al., 1999).
Correct factor retention is a balance between parsimony and explanatory adequacy.
4. Why Factor Retention Is Difficult
Factor retention accuracy depends on several interacting characteristics of the data and of the underlying population structure. The most consistently important influences identified in the simulation literature include sample size, the number of items in the pool, the true number of population factors, the magnitude of factor loadings, the correlations among the factors themselves, the number of indicators per factor, item distributional properties such as skewness, the amount and mechanism of missing data, and the extraction method used, for example principal axis factoring, maximum likelihood, or minimum residual.
A comprehensive simulation comparison manipulated many of these conditions simultaneously and found that different retention methods perform differently depending on the underlying factor model; models with more highly correlated factors, for instance, are more difficult for some traditional approaches, while other approaches, including several simulation based methods, perform comparatively better under those same conditions (Auerswald & Moshagen, 2019; Oladunmoye, 2025).
This body of evidence converges on a single practical conclusion: there is no universal factor retention rule that should be applied blindly to every data set. A method that performs well with well separated, strongly loaded, orthogonal factors in a large sample can perform poorly with weak, correlated factors in a modest sample, and vice versa.
5. The Kaiser Criterion
One of the most familiar retention rules in applied psychometrics is the eigenvalue greater than one rule, sometimes written as the criterion that lambda exceeds one. Under this rule, any factor with an eigenvalue greater than one is retained, on the logic that a retained factor should explain at least as much variance as a single standardised observed variable would explain on its own. Consider the illustrative eigenvalue series in Table 2.
Factor | Eigenvalue | Retain under Kaiser rule? |
|---|---|---|
1 | 8.21 | Yes |
2 | 3.42 | Yes |
3 | 2.01 | Yes |
4 | 1.38 | Yes |
5 | 1.14 | Yes |
6 | 0.87 | No |
Table 2. Illustrative eigenvalues and the resulting Kaiser criterion decision.
Applying the Kaiser rule mechanically to this series would suggest five factors, because the first five eigenvalues each exceed one. Whether that conclusion is defensible depends on evidence considered later in this Note.
6. The Problem with Eigenvalue Greater Than One
The eigenvalue greater than one rule is easy to apply, and that ease of use is precisely why it became so entrenched, appearing as the default option in most commercial statistical packages. However, simplicity does not guarantee accuracy. The methodological literature has repeatedly and consistently criticised the Kaiser criterion because it tends to retain too many factors under a wide range of realistic data conditions, particularly when the number of items is large or when items are highly intercorrelated, and comparative research recommends moving beyond it towards more empirically informed, simulation based procedures (Auerswald & Moshagen, 2019; Goretzko, 2025).
7. The Scree Test
The scree test is associated with Cattell’s approach to identifying the point at which successive eigenvalues transition from substantial common factor variance to relatively minor, largely idiosyncratic residual variation (Cattell, 1966). The researcher plots the eigenvalues against factor number and looks for an inflection, informally called the elbow, beyond which the line flattens into a roughly linear scree, in the geological sense of loose rubble at the base of a slope.
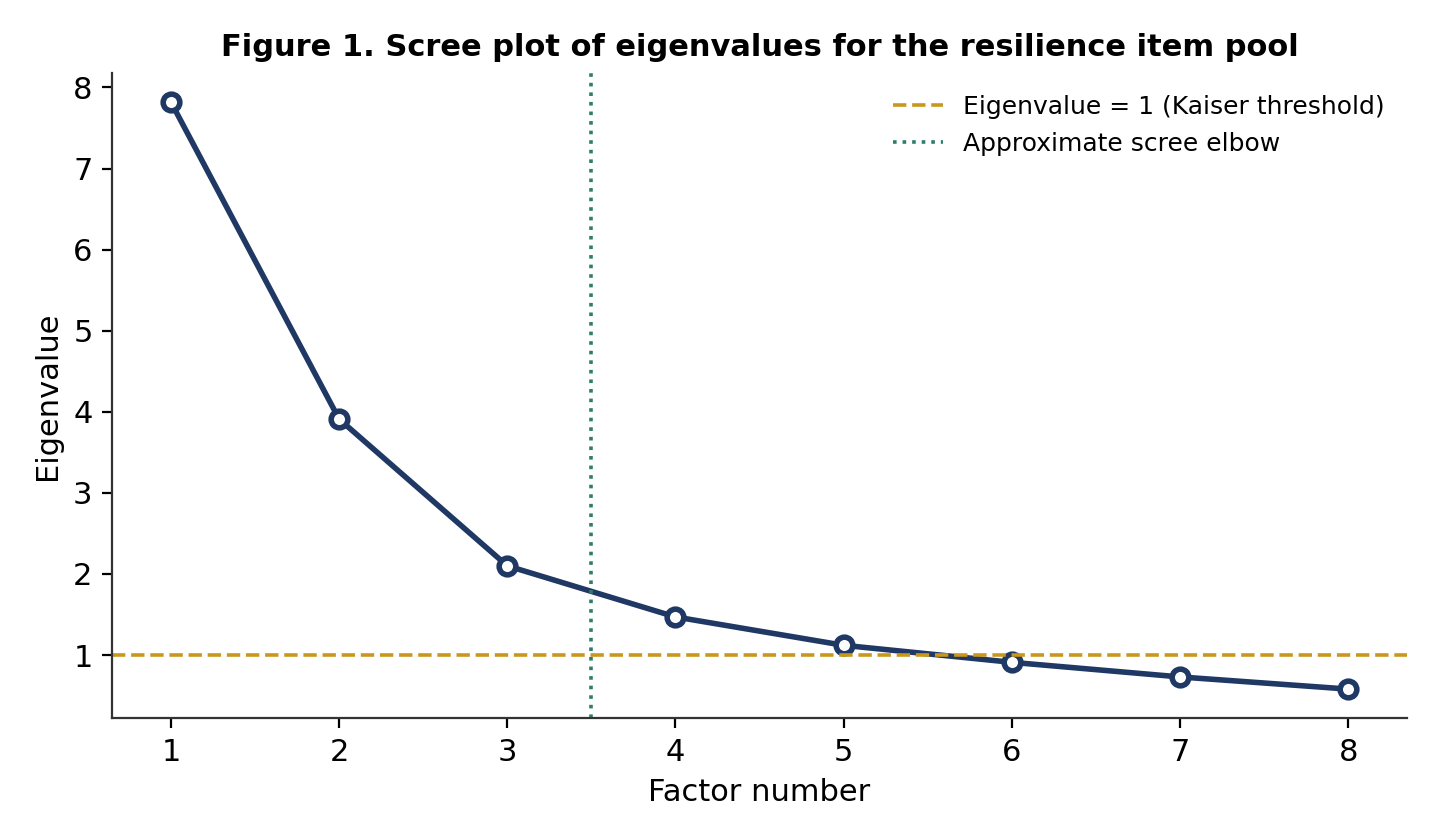
Figure 1. Scree plot of eigenvalues for the illustrative twenty four item resilience pool. The dashed gold line marks the Kaiser threshold of one; the dotted teal line marks the approximate visual elbow.
In this illustrative example, the plot shows a steep drop after the second factor and a further, gentler drop after the third, after which eigenvalues decline only slowly; a researcher might reasonably identify the elbow at three factors, in contrast with the five factors implied by the Kaiser rule alone. The plot's central weakness is that different researchers, looking at the same data, can and do identify different elbows, particularly when the eigenvalue series declines smoothly rather than showing a sharp break. Scree inspection should therefore be treated as one source of converging evidence, not a stand alone decision rule; objective variants, such as the standard error of estimate approach, were developed in part to replace visual judgement with a regression based criterion (Zoski & Jurs, 1993; Oladunmoye, Oyedele, Enamudu, & Nakalema, 2024).
8. Parallel Analysis
Parallel analysis is among the most influential and widely recommended modern approaches to factor retention. It asks a simple question: are the observed eigenvalues larger than eigenvalues that could reasonably be expected to occur by chance alone, given the same sample size and number of variables? The procedure generates many random data sets sharing the sample size and variable count of the observed data but containing no genuine factor structure, extracts eigenvalues from each, and compares the observed eigenvalues against the resulting reference distribution at each factor position. A factor is retained when its observed eigenvalue exceeds the corresponding random reference value. The method was introduced by Horn (1965) and has since been extended and refined extensively, including adaptations for ordinal and missing data. A widely cited tutorial concluded that parallel analysis is among the more accurate retention procedures available and provided detailed, practical implementation guidance (Hayton, Allen, & Scarpello, 2004).
9. Applying, and Qualifying, Parallel Analysis
Table 3 and Figure 2 compare the observed eigenvalues from the resilience example with mean eigenvalues from parallel random data sets of the same size.
Factor | Observed eigenvalue | Mean random eigenvalue | Retain? |
|---|---|---|---|
1 | 7.81 | 1.41 | Yes |
2 | 3.24 | 1.32 | Yes |
3 | 1.72 | 1.25 | Yes |
4 | 1.16 | 1.20 | No |
5 | 0.94 | 1.15 | No |
Table 3. Parallel analysis comparison of observed and random reference eigenvalues.
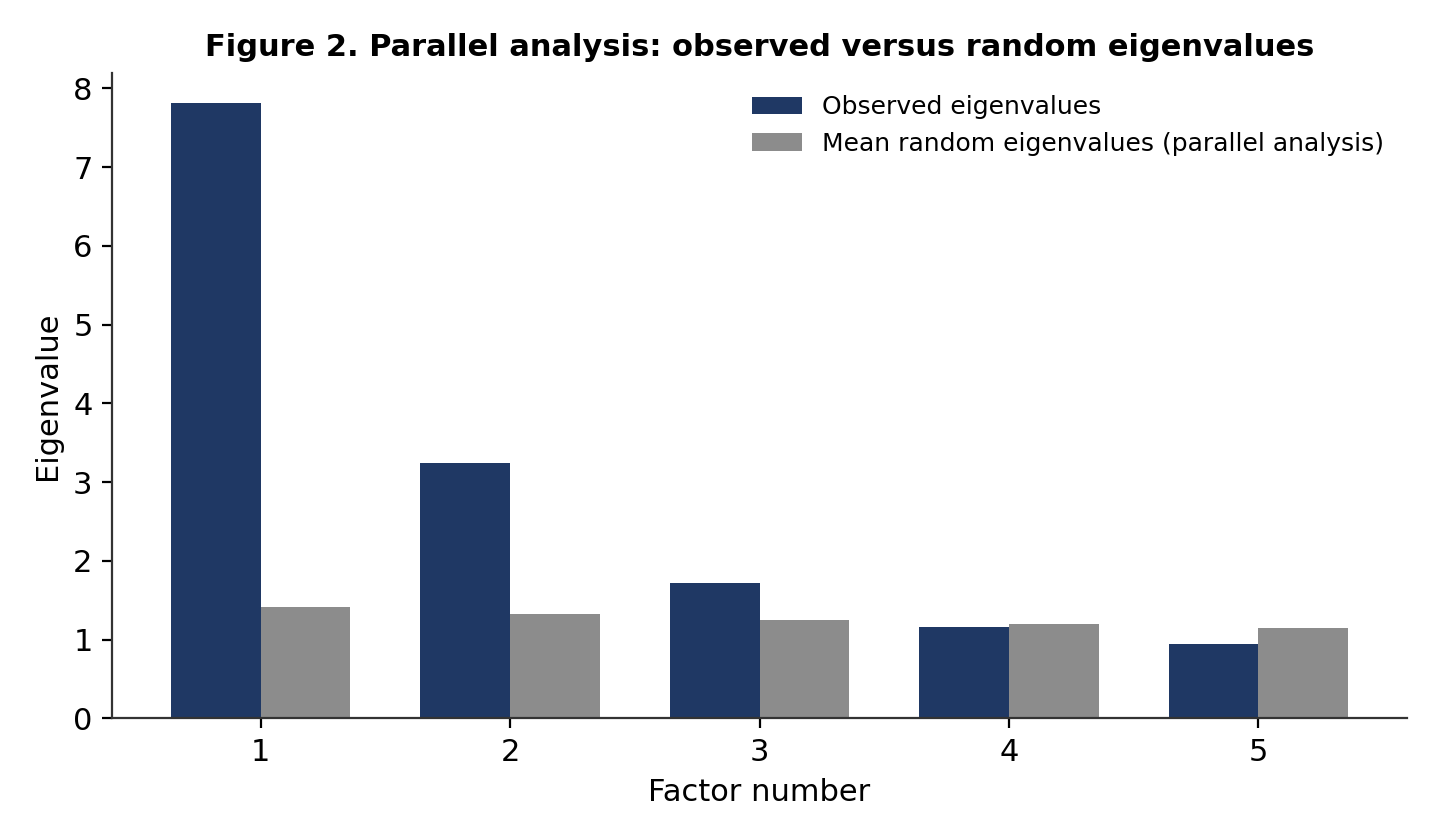
Figure 2. Observed eigenvalues plotted against the mean random reference eigenvalues generated by parallel analysis.
Here the first three observed eigenvalues exceed their random counterparts while the fourth does not, so parallel analysis supports three factors rather than the five suggested by the Kaiser rule alone, illustrating why relying on a single criterion is risky. Even so, parallel analysis is not automatic truth: a large scale comparison found that no single retention method performed best across every factor model simulated (Auerswald & Moshagen, 2019), and a 2025 critical overview called for thoughtful, context sensitive selection of retention procedures rather than universal reliance on any single heuristic, parallel analysis included (Goretzko, 2025).
Missing data add a further complication: if missingness is ignored or handled inconsistently, the resulting correlation structure can distort both the observed and random reference eigenvalues. The accuracy of retention methods depends on the specific combination of missingness mechanism, proportion, and analytical handling used, for example listwise deletion, pairwise deletion, or multiple imputation (Goretzko, Heumann, & Bühner, 2022), so missing data treatment should be decided and documented before, not after, retention diagnostics are run.
10. Minimum Average Partial Correlation and Comparison Data
The minimum average partial correlation procedure, commonly abbreviated as MAP (Velicer, 1976), examines the average squared partial correlation remaining among items after successive components have been extracted and partialled out; the point at which this average reaches its minimum indicates how many factors to retain, since further extraction beyond that point models item specific, non shared variance rather than genuine common structure. Simulation research has repeatedly identified MAP as one of the more accurate retention procedures and a useful converging source of evidence when other criteria disagree (Oladunmoye, Agbor, Olabisi, & Oyadeyi, 2024).
Comparison data methods offer a related approach: rather than comparing observed eigenvalues only with eigenvalues from purely random, uncorrelated data, they construct synthetic reference data reproducing specific candidate factor structures, for example a one, two, or three factor population model, and identify which candidate most closely reproduces the observed eigenvalue pattern, a particularly informative approach when candidate structures are theoretically well specified in advance (Auerswald & Moshagen, 2019).
11. The Hull Method and Exploratory Graph Analysis
The Hull method identifies the factor solution offering the best balance between model fit and the number of parameters estimated, using a convex hull of fit statistics plotted against model complexity, an approach broadly analogous in spirit to the scree test but placed on a more formal, model comparison footing. In simulation work it outperformed several established alternatives, including parallel analysis and MAP, at recovering the correct number of major factors, illustrated using a large personality inventory for which traditional methods suggested implausibly many factors while the Hull method recovered a number of dimensions consistent with the instrument’s theoretical background (Lorenzo Seva, Timmerman, & Kiers, 2011).
Exploratory graph analysis (EGA) departs further from the classical eigenvalue tradition: it estimates a regularised partial correlation network among items and applies a community detection algorithm, commonly walktrap, to identify clusters of densely interconnected items, each interpreted as a dimension. EGA has performed comparably to parallel analysis and other established criteria under a range of conditions, with a particular advantage when factors are highly correlated, a condition under which several classical methods struggle (Golino & Epskamp, 2017). A large scale comparison of these newer approaches again found that performance varies with the underlying factor model and data conditions (Auerswald & Moshagen, 2019; Oladunmoye, 2026b); a modern psychometric platform should not assume any single criterion is universally optimal, and should instead run several appropriate methods and present their outputs together.
12. Statistical and Conceptual Coherence
Convergence among retention criteria on a given number of factors does not, by itself, establish that the resulting factors are meaningful. Each factor must still be interpreted: its item content examined, its labels proposed, and its coherence checked against theory.
A factor supported by only two items loading at, say, .72 and .69 may look statistically tidy, yet if the two items concern unrelated content, for example sleep quality and financial worry, the factor more likely reflects a narrow, sample specific correlation than a genuine psychological construct.
A factor should be judged for statistical coherence and conceptual coherence together, never for either alone.
13. Indicators per Factor and Loading Strength
A factor supported by only one or two items is statistically underdetermined and highly sensitive to sampling fluctuation; a factor supported by four or more clearly loading items is generally more stable and easier to replicate. Table 4 shows a clean four factor loading pattern in which each item loads strongly on one factor and weakly elsewhere.
Item | F1 | F2 | F3 | F4 |
|---|---|---|---|---|
I1 | .79 | .10 | .04 | .02 |
I2 | .76 | .12 | .07 | .03 |
I4 | .11 | .81 | .07 | .05 |
I5 | .13 | .77 | .10 | .08 |
Table 4. Illustrative rotated loading matrix for a well defined four factor solution (selected items shown).
By contrast, a fifth factor supported by only two items with modest loadings of around .40 to .45 adds complexity without a corresponding gain in explanatory clarity: factor retention criteria identify candidate dimensionality, but they do not replace careful inspection of the resulting loading matrix.
14. Theory, Model Comparison, and Replication
When theory, statistical criteria, and interpretability point in different directions, the researcher should compare the leading candidate solutions directly rather than defaulting automatically to whichever source of evidence arrived first. Table 6 illustrates such a comparison across four candidate solutions for the resilience example used throughout this Note.
Criterion | 2 factor | 3 factor | 4 factor | 5 factor |
|---|---|---|---|---|
Parallel analysis | No | Yes | No | No |
Scree plot | No | Yes | Possible | No |
Interpretability | Moderate | Strong | Strong | Weak |
Cross loadings | High | Low | Low | Moderate |
Theoretical fit | Weak | Strong | Strong | Weak |
Table 6. Illustrative comparison of four candidate factor solutions across multiple sources of evidence.
Here the three factor and four factor models emerge as the strongest candidates, with the choice between them resting on theoretical priorities and intended scale use rather than on any single statistic. Even so, the strongest structure is not simply the one that fits best in the discovery sample; it is the one that replicates. A structure supported by EFA in one sample and then confirmed by CFA, ideally alongside measurement invariance testing, in an independent sample provides considerably stronger evidence than one derived and modified within a single data set.
15. Sample Size and Factor Correlations
Because factor retention is an estimation problem rather than a purely computational one, small samples produce unstable correlation matrices and, in turn, unstable eigenvalue orderings near the retention boundary. The appropriate sample size depends jointly on the number of items, communality sizes, loading magnitudes, indicators per factor, and factor correlations, and recent work notes that genuinely ambiguous retention decisions tend to increase, rather than relax, sample size requirements (Goretzko, 2025).
Highly correlated factors add a further layer of difficulty. A correlation of .80 or more between two putative factors raises the question of whether they are truly distinct dimensions or facets of a single broader construct, a question that may call for higher order or bifactor modelling rather than a purely exploratory answer. A sample above two hundred does not, by itself, make factor analysis automatically adequate.
16. Beyond EFA: Confirmatory Validation
A retained EFA structure is best treated as a well justified working hypothesis rather than a final answer. The recommended next steps are confirmatory factor analysis in an independent sample, measurement invariance testing across relevant groups, and, where appropriate, item response theory or differential item functioning analysis at the item level (Oladunmoye, 2026).
Factor retention is one stage in a broader measurement validation process, not the end point of it.
17. A Practical PsychtrixWeb Factor Retention Engine
A modern psychometric platform should function as a structured decision support engine, running multiple appropriate methods and foregrounding points of agreement and disagreement between them, in the spirit recommended by recent methodological reviews (Goretzko, 2025). Table 7 outlines the proposed seven stage PsychtrixWeb factor retention workflow.
Stage | Function |
|---|---|
1. Data preparation | Screen the item pool, check sample size adequacy, and apply a documented, pre specified missing data strategy. |
2. Suitability diagnostics | Compute the Kaiser Meyer Olkin measure and Bartlett’s test of sphericity to confirm the correlation matrix is suitable for factoring. |
3. Multi criterion retention | Run the Kaiser criterion, scree analysis, parallel analysis, MAP, the Hull method, and exploratory graph analysis under harmonised default settings. |
4. Evidence synthesis | Summarise the number of factors suggested by each method in a single evidence dashboard rather than presenting only one method’s output. |
5. Solution comparison | Extract and rotate the two or three most plausible candidate solutions side by side, with loadings, cross loadings, and communalities shown together. |
6. Interpretation support | Flag factors supported by very few items, weak modal loadings, or substantial cross loadings for researcher review. |
7. Reporting | Generate an APA style methods and results narrative, with tables and figures suitable for direct inclusion in a manuscript. |
Table 7. Proposed seven stage PsychtrixWeb factor retention workflow.
18. Evidence Dashboard and Consensus
Rather than reporting a single number of factors, PsychtrixWeb is designed to display a dashboard summarising how many factors each method independently suggests, alongside a qualitative judgement of interpretability. Figure 3 illustrates the format for the resilience example used throughout this Note.
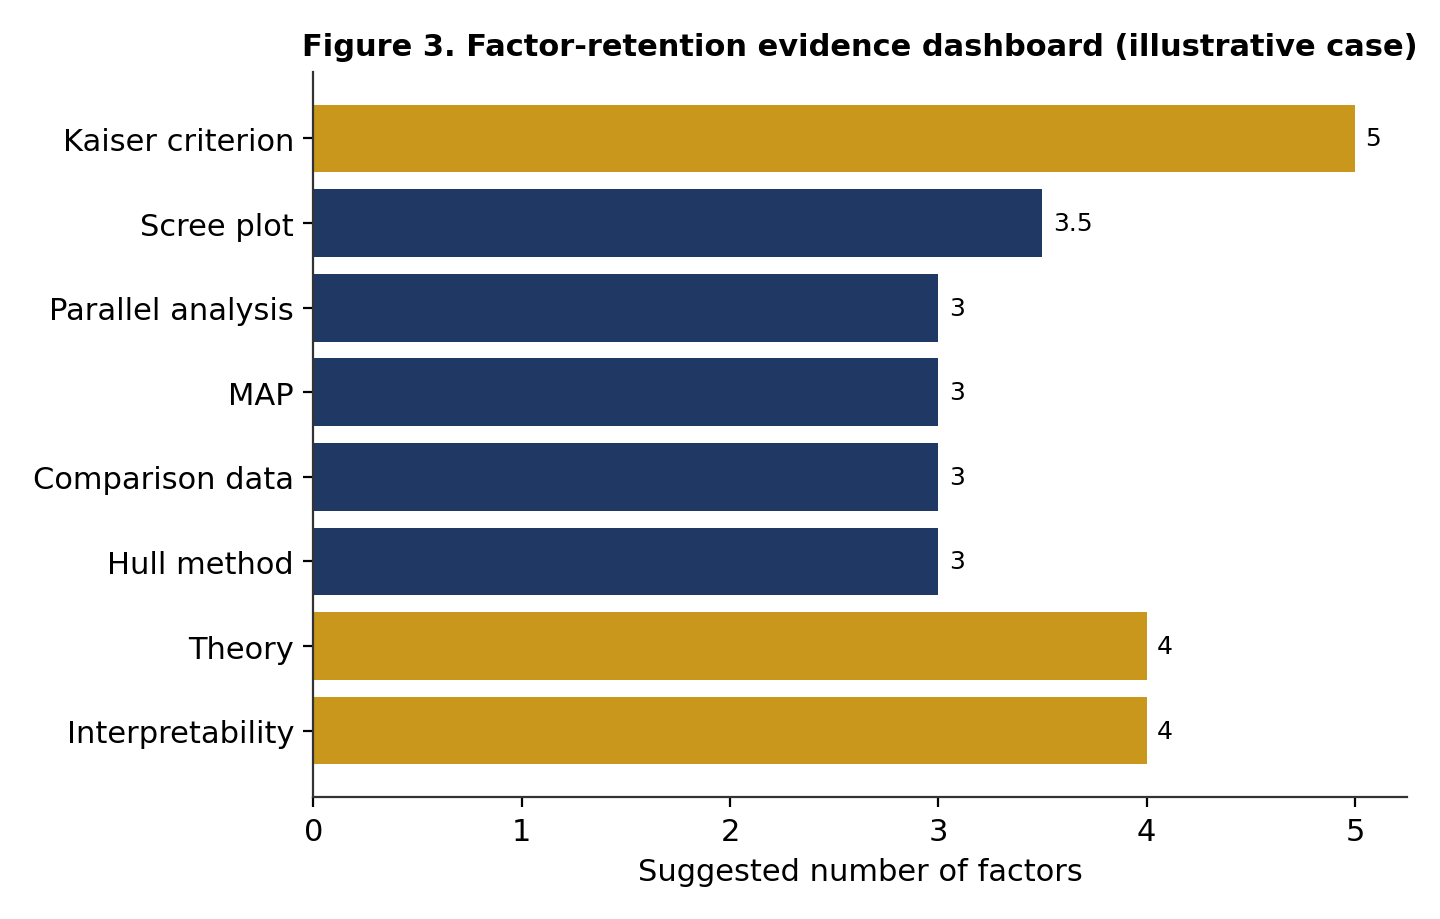
Figure 3. Illustrative PsychtrixWeb evidence dashboard for the resilience item pool.
Here the Kaiser criterion is an outlier at five factors, while parallel analysis, MAP, comparison data, and the Hull method converge on three, and theory favours four. When several methodologically distinct procedures converge on the same number, that convergence is stronger evidence than any single method alone, because the procedures rely on different mathematical logic and are unlikely to share the same bias. When they disagree, as here, that disagreement is itself informative and signals a need for closer inspection rather than a default to whichever figure is most convenient.
19. Transparency, Uncertainty, and Reproducibility
Uncertainty should remain visible rather than being resolved silently. If three factors are strongly supported and a fourth only weakly so, that asymmetry should be reported explicitly. Reproducibility, in turn, depends on complete documentation of every methodological choice: the software and version used, the retention criteria applied, the number of random data sets used in parallel analysis, the extraction and rotation methods, and the missing data strategy. Two researchers analysing the same data but applying different choices at any of these steps can reach different conclusions about dimensionality, so full transparency is what allows a decision to be evaluated, or replicated, by others.
Good psychometric software should show its working, not just its conclusion.
20. Recommended EFA Reporting
A methodologically thorough EFA report addressing factor retention should typically state the extraction method used, for example principal axis factoring or maximum likelihood; the retention criteria applied, together with the specific number of factors each suggested; the rotation method used and the rationale for that choice; the final number of factors retained and a clear justification; the proportion of variance explained; the full rotated loading matrix, including cross loadings; sample size and adequacy diagnostics such as KMO and Bartlett’s test; and the missing data handling strategy, where applicable. An illustrative example of this style of reporting follows (Oladunmoye, & Muhammad, 2024).
Parallel analysis, the minimum average partial correlation procedure, and the Hull method each supported a three factor solution, whereas the Kaiser criterion suggested five factors and the scree plot was ambiguous between three and four. Given the convergence of three empirically grounded methods, together with the theoretical coherence and clean loading pattern of the three factor solution, a three factor structure was retained, accounting for 58.4% of the total variance.
This style of reporting is transparent because it names each criterion used, states its conclusion, and explains rather than simply asserts the final decision.
21. Common Mistakes in Factor Retention
Common mistake | Why it is problematic |
|---|---|
Relying on eigenvalue greater than one alone | Frequently over factors the data, particularly with many or highly intercorrelated items. |
Relying on the scree plot alone | The elbow is often genuinely ambiguous and judged subjectively. |
Ignoring theoretical plausibility | Purely statistical criteria can suggest factors that are conceptually incoherent. |
Failing to inspect the loading matrix | Eigenvalues alone cannot reveal cross loadings or under determined factors. |
Not reporting the retention method used | Substantially reduces reproducibility and transparency. |
Treating EFA output as automatically final | Confirmatory validation in an independent sample is required first. |
Table 8. Common mistakes encountered in applied factor retention practice.
22. A Recommended Decision Framework
Drawing together the evidence and principles discussed throughout this Note, a practical, stepwise decision framework for applied researchers can be summarised as follows.
- Confirm the data are suitable for factor analysis using the Kaiser Meyer Olkin measure and Bartlett’s test of sphericity.
- Compute several retention criteria in parallel, at minimum parallel analysis, MAP, and the scree plot, supplemented where appropriate by the Hull method or exploratory graph analysis.
- Record the number of factors suggested by every method computed, without discarding results that disagree with expectation.
- Extract and rotate the two or three most plausible candidate solutions rather than only the single most popular one.
- Examine the loading matrix for each candidate solution, checking factor strength, cross loadings, and items per factor.
- Evaluate theoretical coherence and substantive interpretability for each candidate solution.
- Select a provisional structure, documenting explicitly why it was preferred over the alternatives considered.
- Seek confirmatory replication in an independent sample before treating the structure as well established.
Figure 4 illustrates, in simplified schematic form, how different retention methods can be expected to behave under different data conditions, reinforcing the case for using several converging methods rather than any single one.
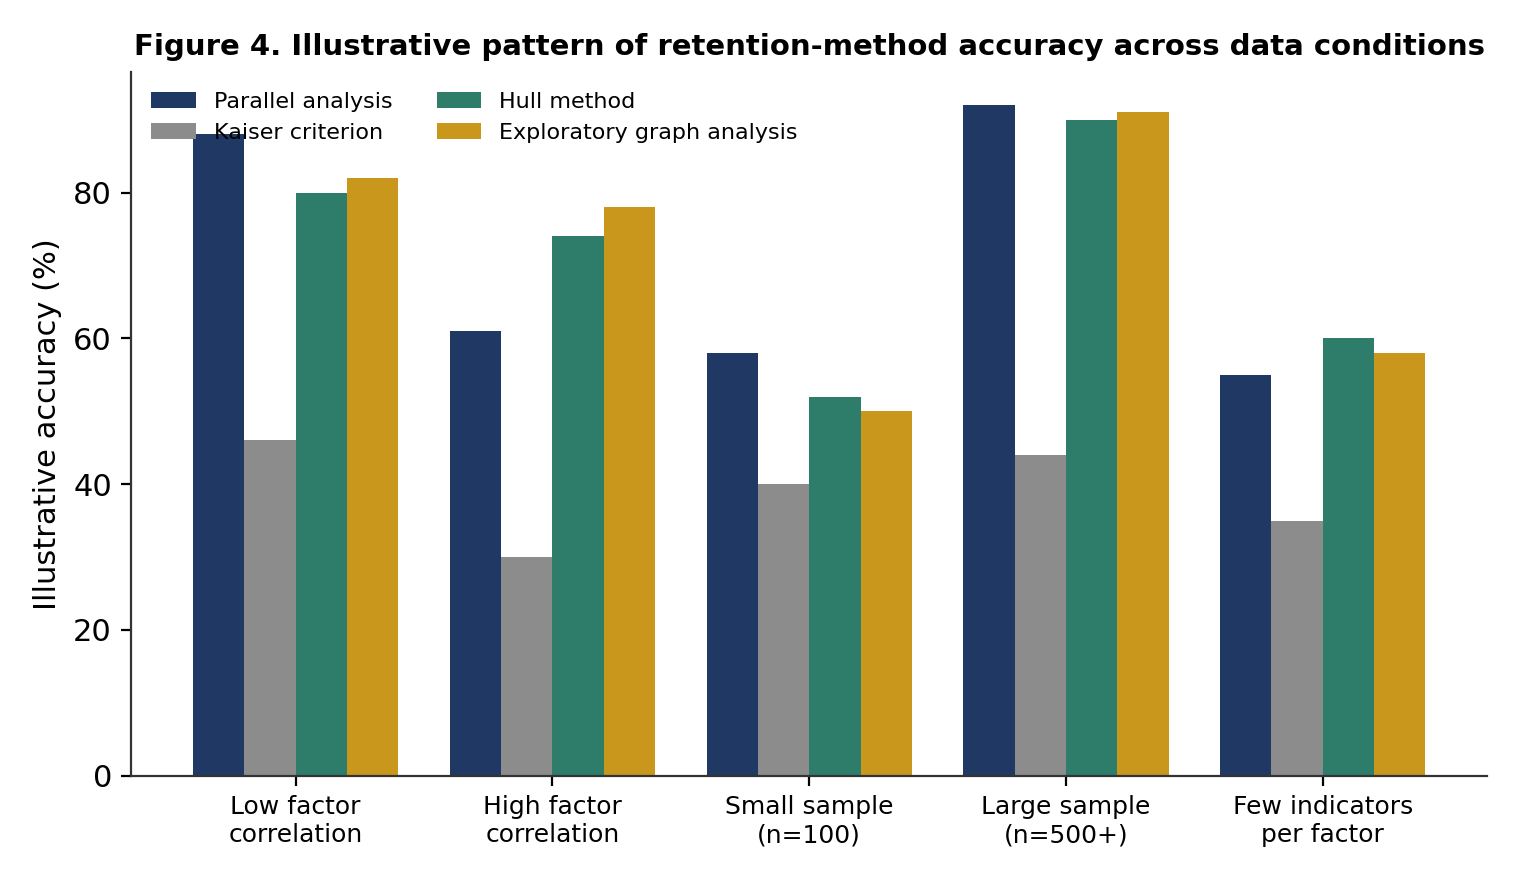
Figure 4. Schematic illustration of how retention method performance can shift across data conditions, based on the general pattern of findings in the simulation literature (Auerswald & Moshagen, 2019; Golino & Epskamp, 2017; Lorenzo Seva et al., 2011). Values are illustrative rather than reproductions of any single published simulation.
23. A Layered PsychtrixWeb Architecture
Building on the seven stage workflow described earlier, a fully realised PsychtrixWeb factor retention module can be organised into six architectural layers, summarised in Table 9.
Layer | Component | Purpose |
|---|---|---|
Data layer | Item response matrix, missing data log | Stores raw and cleaned response data with a documented missing data strategy. |
Diagnostics layer | KMO, Bartlett’s test, communalities | Confirms suitability of the correlation matrix before retention analysis begins. |
Retention layer | Kaiser, scree, parallel analysis, MAP, Hull, EGA | Runs multiple retention criteria under harmonised settings. |
Synthesis layer | Evidence dashboard, convergence index | Aggregates retention outputs and flags disagreement between methods. |
Interpretation layer | Loading review, cross loading and item count flags | Surfaces weak or under determined factors for researcher review. |
Reporting layer | APA style narrative generator | Produces publication ready methods and results text, tables, and figures. |
Table 9. Proposed layered architecture for the PsychtrixWeb factor retention module.
This layered design keeps each analytic function modular and independently testable, while ensuring that the researcher facing output always draws on the complete set of diagnostics rather than on any single, potentially misleading statistic. The broader ambition behind it is to shift software from a passive calculator, which returns a number, to an active decision support partner, which returns evidence, context, and a structured basis for judgement, since factor retention is a converging body of psychometric evidence to be weighed and interpreted, not a single deterministic computation with one correct answer waiting to be found.
24. Key Takeaways
Principle | Practical implication |
|---|---|
No single method is universally correct | Always compute and report more than one retention criterion. |
Kaiser criterion alone is unreliable | Treat eigenvalue greater than one as a starting point, never a final answer. |
Parallel analysis is strong but not infallible | Combine it with MAP, the Hull method, or exploratory graph analysis where possible. |
Statistical and conceptual coherence both matter | Always inspect the loading matrix, not only the eigenvalue series. |
Missing data affects retention accuracy | Decide and document the missing data strategy before running retention diagnostics. |
Replication is essential | Confirm any exploratory structure with confirmatory factor analysis in an independent sample. |
Transparency enables reproducibility | Report every retention method used and the reasoning behind the final decision. |
Table 10. Key takeaways for applied factor retention practice.
25. Conclusion
Determining how many factors underlie a psychological scale is one of the most consequential, and most frequently oversimplified, decisions in scale development. The eigenvalue greater than one rule, though still common in applied practice, is insufficiently accurate to serve as a sole criterion in contemporary psychometric work. Parallel analysis, MAP, the Hull method, exploratory graph analysis, and comparison data procedures each offer valuable, empirically grounded evidence, yet none of them, used alone, guarantees a correct answer under every data condition.
The most defensible approach is to treat factor retention as a converging body of evidence: computing multiple criteria, examining the resulting loading matrices closely, weighing theoretical and interpretive considerations, and seeking independent confirmatory replication before finalising a scale’s dimensional structure. A well designed psychometric platform such as PsychtrixWeb can support this process meaningfully, not by producing a single authoritative number, but by organising and clearly presenting the full body of relevant evidence so that researchers are better equipped to exercise sound psychometric judgement.
The right number of factors is the number that the evidence, taken as a whole, can genuinely support, and that theory and independent replication subsequently confirm.
References
- Auerswald, M., & Moshagen, M. (2019). How to determine the number of factors to retain in exploratory factor analysis: A comparison of extraction methods under realistic conditions. Psychological Methods, 24(4), 468 to 491. https://doi.org/10.1037/met0000200
- Cattell, R. B. (1966). The scree test for the number of factors. Multivariate Behavioral Research, 1(2), 245 to 276. https://doi.org/10.1207/s15327906mbr0102_10
- Fabrigar, L. R., Wegener, D. T., MacCallum, R. C., & Strahan, E. J. (1999). Evaluating the use of exploratory factor analysis in psychological research. Psychological Methods, 4(3), 272 to 299. https://doi.org/10.1037/1082-989X.4.3.272
- Golino, H. F., & Epskamp, S. (2017). Exploratory graph analysis: A new approach for estimating the number of dimensions in psychological research. PLOS ONE, 12(6), e0174035. https://doi.org/10.1371/journal.pone.0174035
- Goretzko, D. (2025). How many factors to retain in exploratory factor analysis? A critical overview of factor retention methods. Psychological Methods. Advance online publication. https://doi.org/10.1037/met0000733
- Goretzko, D., Heumann, C., & Bühner, M. (2022). Factor retention in exploratory factor analysis with missing data. Educational and Psychological Measurement, 82(3), 444 to 464. https://doi.org/10.1177/00131644211022031
- Hayton, J. C., Allen, D. G., & Scarpello, V. (2004). Factor retention decisions in exploratory factor analysis: A tutorial on parallel analysis. Organizational Research Methods, 7(2), 191 to 205. https://doi.org/10.1177/1094428104263675
- Horn, J. L. (1965). A rationale and test for the number of factors in factor analysis. Psychometrika, 30(2), 179 to 185. https://doi.org/10.1007/BF02289447
- Howard, M. C. (2023). A systematic literature review of exploratory factor analyses in management. Journal of Business Research, 164, Article 113969. https://doi.org/10.1016/j.jbusres.2023.113969
- Lorenzo Seva, U., Timmerman, M. E., & Kiers, H. A. L. (2011). The Hull method for selecting the number of common factors. Multivariate Behavioral Research, 46(2), 340 to 364. https://doi.org/10.1080/00273171.2011.564527
- Oladunmoye E.O (2025). Ultra-short scales in employee assessment: balancing efficiency and accuracy. Journal of Applied Sciences, Information and Computing.6(2),103-108.
- Oladunmoye, E. O. (2026a). Exploratory Factor Analysis Versus Confirmatory Factor Analysis. PsychtrixWeb Research Note, 007. Psychtrix Initiative Limited. https://www.psychtrixweb.online/research-notes/007-abstract-3
- Oladunmoye, E. O. (2026b). From Questionnaire to Validated Instrument: A Complete Psychometric Analysis Workflow Using PsychtrixWeb. PsychtrixWeb Research Note, 006. Psychtrix Initiative Limited. https://www.psychtrixweb.online/research-notes/006-1-introduction-2
- Oladunmoye, E. O., (2015). Development and validation of social provision scale on first year undergraduate psychological adjustment. Journal of Education and Practice, 6 (28), 78-90.
- Oladunmoye, E. O., Muhammad T. S., (2024). Development and Validation of Multiple Intelligence Test among emerging adults in the United Kingdom. ISAR Journal of Arts, Humanities and Social Sciences, 2(4), 18-24.
- Oladunmoye, E.O., Agbor, E.C., Olabisi, O.L., and Oyadeyi, J.B., (2024). Estimating measurement invariance on emotional intelligence scale across gender and age among undergraduates in Nigeria. Thinking Skills and Creativity Journal. 7(1),50-60
- Oladunmoye, E.O., Oyedele, O. Leah, Enamudu, G.P., and Faith, Nakalema, (2024). Assessing Psychometric Tools in Online Education: Effectiveness and Obstacles in Virtual Learning Assessments. ISAR Journal of Arts, Humanities and Social Sciences, 2(12), 8-13.
- Patil, V. H., McPherson, M. Q., & Friesner, D. (2010). The use of exploratory factor analysis in public health: A note on parallel analysis as a factor retention criterion. American Journal of Health Promotion, 24(3), 178 to 181. https://doi.org/10.4278/ajhp.08033131
- Velicer, W. F. (1976). Determining the number of components from the matrix of partial correlations. Psychometrika, 41(3), 321 to 327. https://doi.org/10.1007/BF02293557
- Zoski, K., & Jurs, S. (1993). Using multiple regression to determine the number of factors to retain in factor analysis. Multiple Linear Regression Viewpoints, 20(1), 5 to 9.
Suggested citation
PhD, E. O. O. (2026). How Many Factors Does a Psychological Scale Really Have?. PsychtrixWeb Research Note, 009. Psychtrix Initiative Limited. https://www.psychtrixweb.online/research-notes/009-abstract-5Discuss this Research Note
Scholarly comments are welcome from anyone — no account required. Contributions are moderated before they appear.
No comments yet. Start the scholarly discussion below.