
Cronbach's Alpha versus McDonald's Omega
Which Reliability Coefficient Should Researchers Report?
Abstract
Internal consistency is among the most frequently reported measurement properties in psychological, educational, health and social science research. Cronbach's alpha has traditionally dominated the reporting of internal consistency, yet contemporary psychometric scholarship has drawn attention to important limitations in treating alpha as a universal index of reliability. In particular, coefficient alpha rests on assumptions, most notably essential tau-equivalence, that frequently do not hold for psychological scales. When item loadings differ substantially, McDonald's omega offers a more defensible, model-based estimate of reliability under the congeneric measurement conditions that are typical of real scales. This Research Note examines the conceptual distinction between Cronbach's alpha and McDonald's omega, sets out the assumptions underlying each coefficient, demonstrates why a high alpha does not by itself establish unidimensionality or validity, and offers practical guidance for reporting reliability in contemporary psychometric research. The note further considers ordinal response data, multidimensional scales and subscales, confidence intervals, item deletion practice, and the implications of assumption-aware reliability assessment for automated psychometric platforms such as PsychtrixWeb. Rather than arguing that omega should replace alpha in every circumstance, the note advocates a measurement-model-first approach in which researchers select and interpret reliability coefficients according to the structure of the instrument and the intended interpretation of scores. Keywords: Cronbach's alpha; McDonald's omega; reliability; internal consistency; coefficient alpha; omega coefficient; scale development; psychometrics; measurement error; PsychtrixWeb.
1. Introduction
Consider a researcher who develops a twenty-item psychological scale and obtains an internal consistency coefficient of alpha equal to 0.94. The researcher writes, in the results section of a manuscript, that the instrument demonstrated excellent reliability. This is a routine sentence, repeated in thousands of published articles every year. Yet it is worth pausing to ask exactly what the figure of 0.94 establishes.
Does a high alpha coefficient prove that the scale is unidimensional? Does it prove that every item measures the same construct, or that items have equal relationships with the latent construct they are said to represent? Does it prove that the scale is valid, that the total score is an appropriate summary of the items, or that the scale will replicate in another population? The answer to each of these questions is no. Cronbach's alpha is an estimate of internal consistency obtained under particular assumptions. It is not a universal indicator of instrument quality, and treating it as one has become one of the more persistent misunderstandings in applied psychometric practice.
This distinction has grown more important as psychometric practice has shifted toward model-based approaches to reliability estimation. McDonald's omega has received sustained attention in the methodological literature because it can accommodate unequal item-factor relationships more naturally under a congeneric measurement model, in which items are permitted to relate to the underlying construct with differing strength (Dunn, Baguley and Brunsden, 2014; McNeish, 2018). The present Research Note reviews the conceptual, statistical and practical distinctions between alpha and omega, and considers what an assumption-aware approach to reliability reporting should look like, both for individual researchers and for automated psychometric platforms such as PsychtrixWeb.
2. What Is Reliability?
Reliability concerns the consistency, or precision, of measurement. Classical test theory represents an observed score as the sum of a true-score component and an error component:
X = T + E
where X denotes the observed score, T denotes the true-score component, and E denotes measurement error. Reliability can then be conceptualised as the proportion of observed-score variance attributable to the true-score component rather than to measurement error:
ρXX' = σ²T / σ²X
In words, reliability concerns the share of observed-score variance that is systematic rather than error. It is essential to recognise, however, that reliability is not a single, fixed property that an instrument possesses once and for all. Reliability depends on the score being examined, the population in which it is estimated, the conditions of administration, the measurement model assumed, and the interpretation that the researcher intends to place on the score. A coefficient obtained in one study is, strictly speaking, an estimate of reliability for that particular sample and score, not an immutable characteristic of the instrument itself (Oladunmoye, 2025).
3. Internal Consistency as a Measurement Concept
Internal consistency examines the relationships among items that are intended to contribute to the same score. Suppose a researcher measures academic self-efficacy using five items. If the items are intended to measure the same underlying construct, their responses should demonstrate meaningful, positive relationships with one another. Alpha and omega represent two broad approaches for summarising this internal consistency, but they rest on different assumptions about how items relate to the construct they measure, and it is this difference in assumptions, rather than mere computational preference, that motivates the remainder of this note.
4. Cronbach's Alpha: Derivation and Logic
Cronbach's alpha was introduced by Lee Cronbach in 1951 as a generalisation of earlier split-half approaches to reliability estimation (Cronbach, 1951). For k items, alpha can be expressed as:
α = [k / (k − 1)] × [1 − (Σ σ²i / σ²X)]
where k is the number of items, σ²i is the variance of item i, and σ²X is the variance of the total score. An equivalent formulation expresses alpha as a function of the number of items and the average inter-item covariance. This alternative formulation is instructive because it makes explicit a feature of alpha that is often overlooked in practice: alpha is influenced jointly by the strength of the relationships among items and by the number of items in the scale. A scale can therefore obtain a high alpha coefficient not because its items are strongly related to one another, but simply because it contains many items.
5. Why Adding Items Can Inflate Alpha
The Spearman-Brown relationship illustrates this point clearly. For standardised items, alpha can be written as:
α = (k r̄) / [1 + (k − 1) r̄]
where k is the number of items and r̄ is the average inter-item correlation. Table 1 and Figure 1 illustrate the consequence of this relationship using two hypothetical scales. Scale A contains five items with an average inter-item correlation of 0.50, while Scale B contains twenty items with a weaker average inter-item correlation of 0.30.
Scale | Number of items (k) | Average inter-item correlation | Estimated alpha |
|---|---|---|---|
Scale A | 5 | 0.50 | 0.83 |
Scale B | 20 | 0.30 | 0.90 |
Table 1. Illustration of how scale length can offset weaker average item relationships.
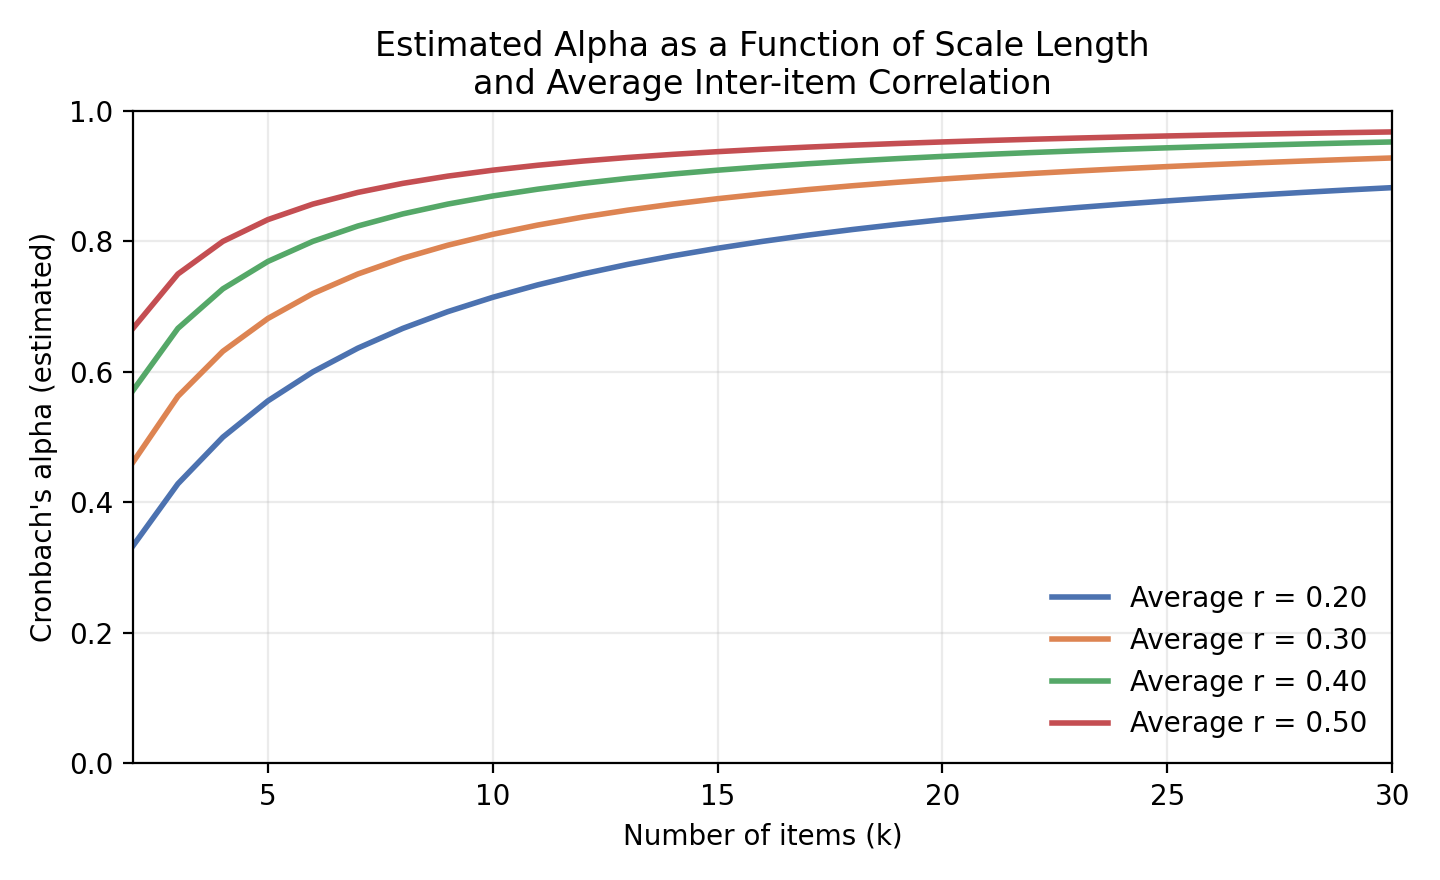
Figure 1. Estimated alpha as a function of the number of items and the average inter-item correlation, calculated from the Spearman-Brown relationship.
Scale B obtains the higher alpha coefficient despite the weaker relationships among its individual items. This illustrates a general and important point: a higher alpha coefficient does not automatically indicate better measurement, because item quantity itself contributes to the value of the statistic. Researchers should therefore avoid interpreting alpha in isolation from the scale's dimensionality, item content, and intended use, and should be cautious when comparing alpha coefficients across scales of differing length.
6. The Tau-Equivalence Problem
One of the principal concerns with alpha concerns its relationship to the assumption of tau-equivalence. Under a simplified tau-equivalent model, items are assumed to relate to the underlying construct with equal strength, differing only in their intercepts and in the amount of measurement error attached to each item. In practical terms, tau-equivalence implies that every item contributes to the latent construct in a comparable way.
Psychological items, however, frequently display unequal factor loadings. A five-item scale might, for example, produce standardised loadings of 0.85, 0.79, 0.72, 0.55 and 0.38. This is a congeneric rather than a tau-equivalent pattern: the items clearly do not contribute equally strongly to the latent construct. When tau-equivalence is violated in this way, alpha is known to underestimate reliability under some conditions and to misrepresent the structure of measurement error under others, which is precisely the circumstance in which McDonald's omega becomes the more defensible estimator (Raykov, 1997; Revelle and Zinbarg, 2009).
7. McDonald's Omega: A Model-Based Alternative
McDonald's omega is based directly on a latent-variable measurement model rather than on the observed-score covariance structure alone (McDonald, 1999). For a one-factor congeneric model, a simplified conceptual expression for omega is:
ω = (Σ λi)² / [(Σ λi)² + Σ θi]
where λi represents the factor loading for item i and θi represents the item-specific or error variance associated with that item. The exact formulation varies according to the particular omega coefficient chosen (for example, omega total, omega hierarchical, or ordinal omega) and according to the model specification adopted. The essential conceptual distinction, however, is straightforward: omega incorporates differences in item loadings directly into the reliability estimate, whereas alpha's derivation implicitly assumes those differences away. This makes omega particularly informative when items are congeneric rather than tau-equivalent, which is the typical case for most psychological measures (Hayes and Coutts, 2020).
8. Comparing Alpha and Omega Under Varying Loading Patterns
The practical consequence of the tau-equivalence assumption can be illustrated with a simple worked comparison. Table 2 presents four hypothetical five-item scales in which the degree of heterogeneity among factor loadings increases progressively, from a scale with equal loadings to a scale with markedly unequal loadings. Figure 2 plots the corresponding alpha and omega estimates for each scenario, computed from a simple congeneric simulation in which residual variances are held constant across items.
Scenario | Illustrative item loadings | Alpha | Omega |
|---|---|---|---|
Equal loadings | 0.70, 0.70, 0.70, 0.70, 0.70 | 0.71 | 0.71 |
Mild heterogeneity | 0.75, 0.72, 0.70, 0.66, 0.62 | 0.70 | 0.70 |
Moderate heterogeneity | 0.85, 0.79, 0.72, 0.55, 0.38 | 0.67 | 0.68 |
Strong heterogeneity | 0.90, 0.80, 0.60, 0.40, 0.20 | 0.60 | 0.63 |
Table 2. Illustrative alpha and omega estimates as factor loadings become progressively more unequal, computed under a simple congeneric model with fixed residual variance.
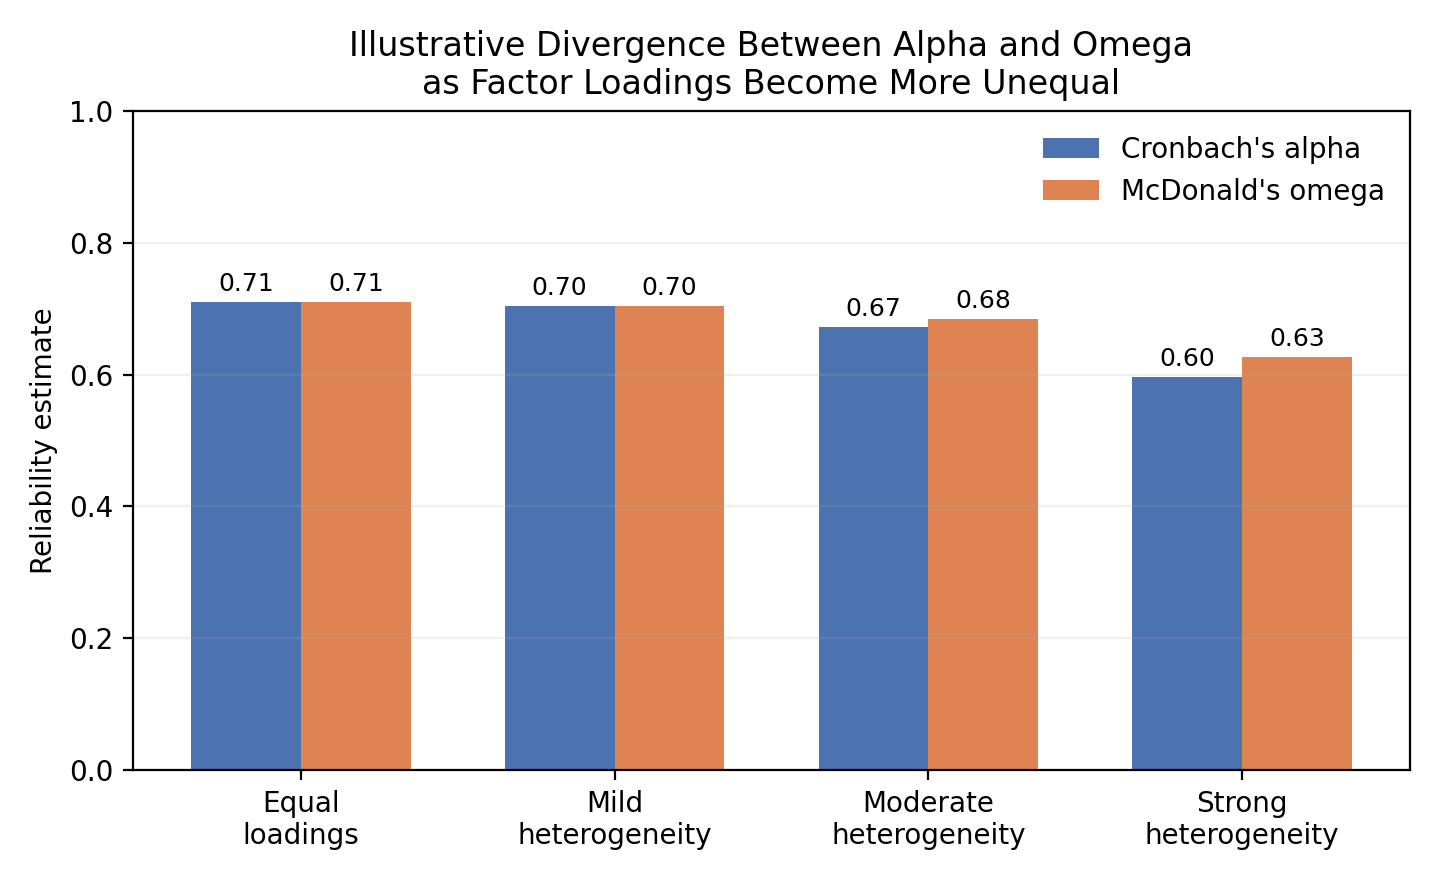
Figure 2. As item loadings become increasingly heterogeneous, alpha declines more steeply than omega, illustrating why omega is generally preferred for congeneric scales.
When loadings are equal, alpha and omega coincide, which is consistent with the fact that alpha is a special case of omega under strict tau-equivalence. As loadings become more heterogeneous, the two coefficients diverge, with alpha declining more sharply. This divergence is not a statistical curiosity; it reflects a genuine difference in what each coefficient is estimating, and it is the principal reason that several contemporary psychometric authors recommend routinely considering omega alongside, or in place of, alpha (Dunn, Baguley and Brunsden, 2014; McNeish, 2018).
9. Alpha Is Not Obsolete: A Balanced Position
An important corrective is necessary at this point. The argument developed in this note is not that Cronbach's alpha is obsolete or that it should never be reported. That would be an oversimplification, and it would also misrepresent the methodological literature, some of which has defended a continued, judicious role for alpha (Raykov and Marcoulides, 2017). Alpha remains a useful and interpretable statistic when its assumptions are reasonably compatible with the measurement model underlying a given scale, and it retains the practical advantage of requiring no more than a single test administration and simple software support.
The more defensible position, and the one adopted throughout this note, is that alpha should not be used automatically or unreflectively. Researchers should evaluate whether alpha is appropriate for the scale and measurement model at hand, and should report omega, composite reliability, or another model-based alternative when tau-equivalence is implausible. This distinction matters particularly in methodological education, where alpha is too often taught as an unconditional marker of scale quality rather than as a conditional statistical estimator.
10. Common Misconceptions: Unidimensionality and Validity
10.1 Alpha does not establish unidimensionality
This is perhaps the most common misconception in applied use of alpha. Suppose a researcher obtains alpha equal to 0.91 and concludes that the scale is therefore unidimensional. This conclusion does not follow from the coefficient alone. A multidimensional scale can produce a high alpha coefficient if its dimensions are correlated with one another and if the scale contains a reasonably large number of items. Dimensionality should instead be evaluated using procedures such as exploratory factor analysis, confirmatory factor analysis, and bifactor modelling, rather than inferred from a reliability coefficient. This point connects directly with the treatment of exploratory and confirmatory factor analysis in Research Note 006 of this series.
10.2 Alpha does not establish validity
A related misconception treats a high reliability coefficient as evidence of construct validity. Reliability and validity are related but conceptually distinct properties of measurement. A scale can be highly internally consistent while measuring the wrong construct, or a construct that is narrower than intended. Fifteen items that all measure one very narrow aspect of examination anxiety could plausibly produce an alpha coefficient of 0.96 while failing to represent the broader construct that the researcher claims to measure. Reliability, in short, is not equivalent to validity, and a strong reliability argument should never be presented as a substitute for validity evidence.
11. Extremely High Alpha as a Warning Sign
Researchers sometimes celebrate an alpha coefficient of 0.98 or higher as an unambiguous achievement. In fact, extremely high internal consistency can indicate item redundancy rather than excellent measurement. Consider three items such as: 'I feel worried about my examination performance', 'I feel anxious about my examination performance', and 'I am concerned about how I will perform in examinations'. These items are close paraphrases of one another rather than distinct indicators of the construct. A twenty-item scale composed largely of such near-duplicates may produce an impressively high alpha coefficient while offering limited breadth of construct representation. Researchers should therefore inspect item content, inter-item correlations, factor loadings, item-total relationships and the degree of redundancy among items, rather than treating a very high alpha coefficient as an unqualified success.
12. Reliability at the Score Level: Subscales and Composites
Suppose a questionnaire measuring psychological wellbeing contains twenty items organised into four dimensions: emotional wellbeing, social functioning, self-acceptance, and purpose in life. A researcher should not automatically calculate a single total-score alpha coefficient without first asking whether a total score is theoretically and empirically justified. If the instrument is genuinely multidimensional, reliability may need to be examined separately for each subscale, yielding four distinct omega or alpha coefficients rather than one undifferentiated figure for the whole instrument.
Researchers using confirmatory factor analysis frequently encounter composite reliability, sometimes abbreviated CR. A simplified expression for composite reliability is:
CR = (Σ λi)² / [(Σ λi)² + Σ θi]
The exact implementation depends on the measurement model and on whether standardised or unstandardised parameters are used. Composite reliability is conceptually related to omega because both rely on factor loadings and error variances rather than on the observed-score covariance structure alone. Alpha, omega and composite reliability should not, however, be treated as interchangeable statistics; they answer related but not identical methodological questions, and a careful report should specify which coefficient was calculated and why.
Confirmatory factor analysis also provides a particularly useful environment for reliability analysis more generally. Suppose a single factor is indicated by four items with standardised loadings of 0.82, 0.79, 0.74 and 0.68. The confirmatory factor model supplies the loading and error-variance estimates needed to compute model-based reliability directly, which is one reason the combination of confirmatory factor analysis and omega is generally more informative than reporting alpha alone.
13. Ordinal Data and Polychoric Reliability
Many psychological instruments use ordinal response categories, typically ranging across options such as strongly disagree, disagree, neutral, agree and strongly agree. Researchers frequently calculate ordinary alpha directly from Pearson correlations among these ordinal responses. When the items are ordinal and the response distributions are markedly non-normal, however, researchers should consider polychoric correlations, ordinal alpha, categorical factor models, and other estimators designed for categorical data. The appropriate method depends on the number of response categories, the shape of the response distribution, sample size, the nature of the construct, and the analytical model adopted.
Consider a five-point Likert scale in which responses cluster heavily around the 'agree' category. The observed Pearson correlations among such skewed items may understate the relationships among the underlying, continuous response propensities that are assumed to generate the observed categories. A polychoric correlation approach attempts to model these underlying continuous relationships directly, and this can materially affect the resulting reliability estimate. Researchers should therefore report how reliability was calculated, rather than reporting only that 'Cronbach's alpha was 0.87' without further specification. A well-designed psychometric platform should distinguish clearly between continuous-data reliability and ordinal-data reliability rather than defaulting silently to Pearson-based alpha.
14. Confidence Intervals and Sample Dependence
A reliability coefficient is a sample estimate, not a fixed population parameter known with certainty. Suppose omega is estimated at 0.84. A more informative report would present this alongside a confidence interval, for example omega equal to 0.84 with a ninety-five per cent confidence interval from 0.80 to 0.88. The interval communicates the degree of uncertainty around the point estimate, which becomes especially useful when comparing reliability across different scales, subscales, populations, or measurement occasions. Reliability should therefore be treated as an estimated property of a score in a particular sample, rather than as an immutable characteristic of an instrument in the abstract.
This point connects directly to the population dependence of reliability more generally. An instrument does not possess a single, permanent reliability coefficient that applies unconditionally across all contexts. Alpha estimated at 0.89 in a sample of university students might fall to 0.76 among adolescents, or rise to 0.93 among clinical patients. Such differences can arise from sample heterogeneity, construct variability across groups, differing response distributions, translation effects, differing administration conditions, and differential item functioning. Researchers should therefore report reliability for the specific sample in which scores are being interpreted, rather than relying on the reliability figure reported in the original validation study.
15. Reliability, Range Restriction and Short Scales
Range restriction presents a related complication. Suppose a scale measures academic motivation among a highly selective group of academically high-performing students. Responses in such a homogeneous sample may show relatively little variability, and restricted variance can alter both the observed correlations among items and the resulting reliability estimate. In general terms, the reliability estimate obtained is a function of the measurement model, the sample, and the degree of response variability present in that sample; it should not be assumed to transfer automatically from one context to another.
Short scales present a further, specific difficulty. With only three or four items, alpha can appear modest even when the items show meaningful relationships with one another, because alpha is partly a function of scale length, as demonstrated earlier in Table 1 and Figure 1. Researchers should therefore avoid imposing identical numerical expectations on very short scales and on much longer instruments. For short scales in particular, it is often more informative to examine omega, the average inter-item correlation, test-retest reliability where relevant, construct validity evidence, and the adequacy of content coverage, rather than relying on alpha in isolation.
16. Contextual Interpretation: Beyond the 0.70 Rule
A commonly repeated methodological statement holds that reliability is acceptable once alpha exceeds 0.70. This rule is too simplistic to serve as a universal standard. There is no single alpha threshold that guarantees adequate reliability across every research context. Interpretation should instead depend on the purpose of the assessment, the developmental stage of the instrument, the consequences attached to decisions made on the basis of scores, the number of items, the nature of the construct, the population studied, and the measurement model adopted. A preliminary research instrument used to explore a new construct may reasonably be held to different expectations than an instrument used to make high-stakes decisions about individuals, such as clinical diagnosis or personnel selection. The coefficient value must, in short, be interpreted in context rather than compared mechanically against a fixed numerical benchmark.
17. Item Deletion Practice
Suppose alpha for a scale is calculated at 0.88, and that deleting a particular item, referred to here as Item 7, would raise alpha to 0.91. It is tempting to delete Item 7 automatically in pursuit of a marginally higher coefficient. This practice should be resisted, because the item in question may represent an important and conceptually distinct facet of the construct that other items do not capture. Table 3 presents a hypothetical before-and-after comparison of the kind that a psychometric platform might display to a researcher considering this decision.
Condition | Alpha | Omega | Recommended action |
|---|---|---|---|
Before deleting Item 7 | 0.88 | 0.90 | Retain and review content |
After deleting Item 7 | 0.91 | 0.92 | Improves statistics only |
Table 3. Illustrative reliability statistics before and after the deletion of a single item, showing that statistical improvement should not be equated with an appropriate editorial decision.
Statistical improvement of this kind should not be interpreted as a straightforward warrant for removing the item. The appropriate response is instead a message of the following kind: deleting Item 7 improves internal consistency, but the item's conceptual contribution should be reviewed before removal is finalised. This approach prevents the pursuit of psychometric optimisation from collapsing into simple statistical pruning of items on the basis of a single coefficient.
18. Reliability, Item Response Theory and Measurement Precision
Reliability coefficients such as alpha and omega provide a single, global summary of internal consistency for the scale as a whole. Item response theory, by contrast, provides conditional measurement precision that varies across levels of the underlying latent trait. The test information function, denoted here as a function of the trait level theta, shows how precisely an instrument measures respondents at different points along that trait. In broad terms, alpha and omega describe global internal consistency, whereas item response theory describes precision across the range of the trait being measured.
This distinction matters in practice. A scale may achieve an omega coefficient of 0.90 overall, yet provide excellent measurement precision near the centre of the trait distribution and comparatively poor precision at its extremes. Global reliability coefficients do not, by themselves, indicate where along the trait continuum an instrument measures most accurately. For this reason, more advanced psychometric workflows should connect classical test theory, factor analysis, reliability estimation, item response theory, and computerised adaptive testing as a coherent sequence, rather than treating these as unrelated analytical modules.
19. Reliability and Measurement Invariance
Suppose omega is estimated at 0.91 in one group and at 0.78 in a second group. This difference may indicate differing measurement precision between the groups, but it does not, by itself, establish that the instrument is measurement non-invariant across those groups. Measurement invariance requires dedicated invariance analyses, typically conducted within a multi-group confirmatory factor framework, examining configural, metric and scalar invariance in turn. Reliability differences and measurement invariance testing address related but distinct questions, and the two forms of analysis should be connected in a comprehensive validation study without being conflated with one another (Oladunmoye, Agbor, Olabisi, & Oyadeyi, 2024).
20. A Recommended Reliability Workflow
The considerations reviewed in this note point toward a defensible, sequential workflow for reliability analysis, summarised in Table 4. The central principle underlying the workflow is that reliability analysis should follow, rather than precede, an understanding of the measurement structure of the instrument.
Step | Task |
|---|---|
1 | Define the construct and its intended scope |
2 | Establish dimensionality (EFA or CFA) |
3 | Select an appropriate measurement model |
4 | Examine item loadings for heterogeneity |
5 | Calculate Cronbach's alpha |
6 | Calculate McDonald's omega |
7 | Examine item redundancy and content overlap |
8 | Evaluate whether a total score is justified |
9 | Assess other reliability evidence (test-retest, inter-rater) |
10 | Assess validity evidence |
11 | Replicate in an independent sample |
Table 4. A recommended, sequential reliability workflow, in which statistical estimation follows an understanding of the measurement model.
21. Implications for PsychtrixWeb
PsychtrixWeb should ideally provide researchers with a reliability intelligence layer rather than a single alpha button. Under this approach, a researcher who uploads a questionnaire would receive a reliability dashboard reporting several coefficients together, rather than a solitary alpha value presented without context. Table 5 and Figure 3 illustrate the kind of output such a dashboard might produce for a hypothetical six-item scale.
Statistic | Value |
|---|---|
Cronbach's alpha | 0.86 |
McDonald's omega | 0.89 |
Composite reliability | 0.90 |
Average inter-item correlation | 0.47 |
95% confidence interval | Displayed where estimable |
Table 5. Example reliability dashboard output for a hypothetical six-item scale.
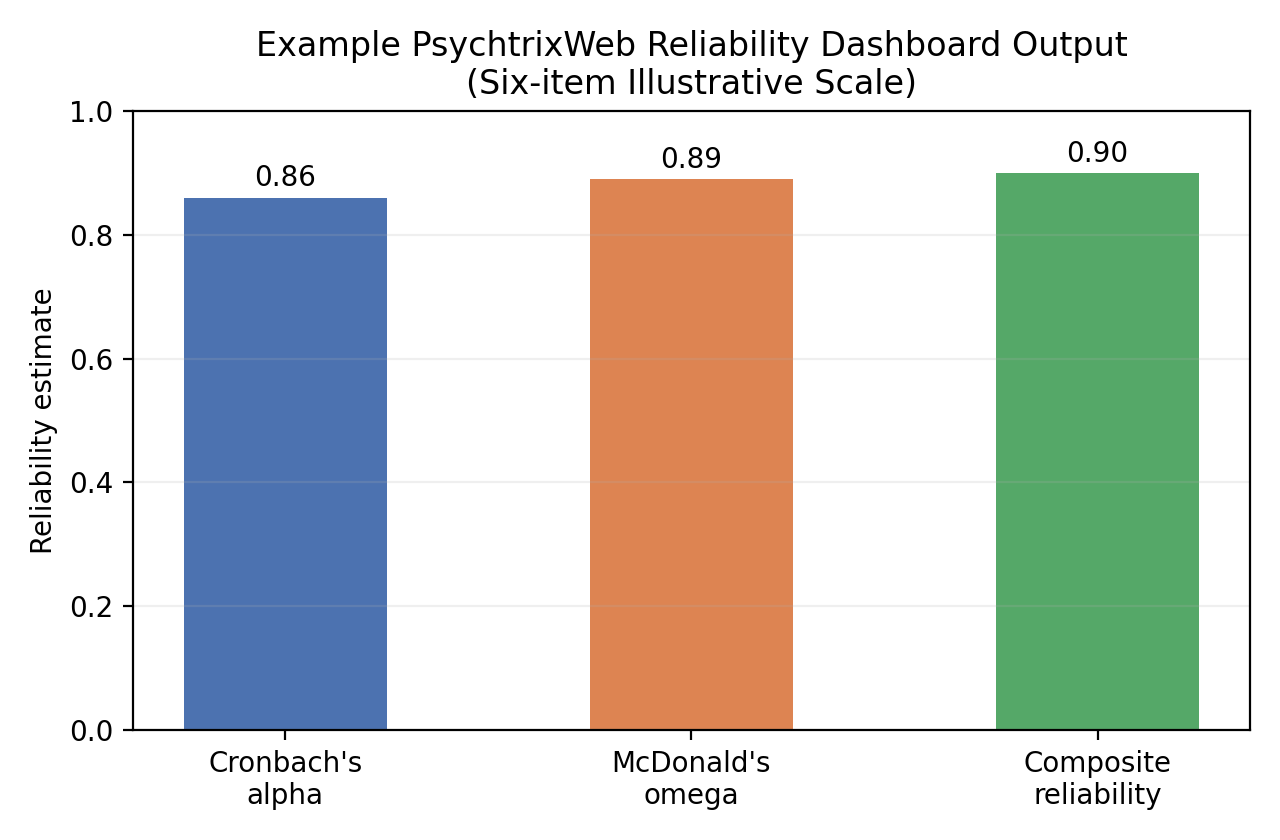
Figure 3. Example PsychtrixWeb reliability dashboard output for a six-item illustrative scale.
Beyond reporting these coefficients, PsychtrixWeb could automatically examine several further diagnostics: whether the scale is approximately unidimensional; whether factor loadings are highly unequal; whether item correlations are excessively high, suggesting redundancy; which items contribute weakly to the total score; whether a subscale structure makes a single total score defensible; and whether ordinal-data methods would be preferable to Pearson-based estimation (Oladunmoye, 2026b). The system could then generate an interpretive narrative rather than a bare statistic. Instead of a message reading 'Cronbach's alpha equals 0.91, excellent reliability', the platform could produce an interpretation of the following kind: the scale demonstrates strong internal consistency; McDonald's omega, at 0.92, is slightly higher than Cronbach's alpha, at 0.88, suggesting that item loadings are not fully equivalent; confirmatory factor analysis indicates a predominantly one-factor structure, although Item 7 shows a relatively low standardised loading; Item 7 should be reviewed before any decision to remove it is made, since statistical performance should be weighed alongside content coverage.
This style of output is considerably more useful to researchers than a bare coefficient, because it explains why the coefficients take the values they do rather than simply reporting the values themselves. An advanced platform of this kind would not merely calculate alpha and omega; it would help researchers understand why the two values differ, for example because factor loadings are unequal across items, so that omega, which incorporates these loading differences, becomes the more appropriate coefficient when items are markedly congeneric. In this sense, the software itself becomes part of the researcher's methodological education rather than a passive calculator.
22. Recommended Reporting Practice
For many contemporary studies, a useful reporting strategy addresses five elements together, summarised in Table 6: evidence of dimensionality, drawn from exploratory or confirmatory factor analysis; an internal consistency estimate, using omega, alpha, or both, selected according to the assumptions that are plausible for the scale; model-based reliability, where confirmatory factor analysis is available; other relevant reliability evidence, such as test-retest reliability, inter-rater reliability, or alternate-form reliability; and validity evidence, including structural and external relationships with other measures (Oladunmoye &Muhammad, 2024).
Element | What to report |
|---|---|
Dimensionality | EFA or CFA evidence supporting the factor structure |
Internal consistency | Omega and/or alpha, with justification for the choice |
Model-based reliability | Composite reliability where CFA is available |
Other reliability evidence | Test-retest, inter-rater or alternate-form reliability |
Validity evidence | Structural and external relationships with other constructs |
Table 6. A recommended five-element reporting strategy for reliability in contemporary psychometric research.
A worked example is instructive. Suppose a researcher analyses a six-item scale and obtains alpha equal to 0.86 and omega equal to 0.89. Rather than asking which figure is correct, the researcher should ask what measurement model generated these estimates, and which coefficient best reflects the assumptions of that model. The difference between the two figures is not merely computational; it is theoretical, and it reflects a substantive judgement about how the items relate to the construct being measured.
Applying this logic to a written report, a weaker statement such as 'the questionnaire was reliable because Cronbach's alpha was 0.89' can be replaced with a considerably stronger report:
The twelve-item scale demonstrated adequate internal consistency, with Cronbach's alpha of 0.89 and McDonald's omega of 0.91. Confirmatory factor analysis supported the hypothesised one-factor structure, although item loadings varied across indicators. The omega estimate was therefore considered particularly informative, because it accommodates unequal factor loadings. Reliability was interpreted alongside evidence of structural validity, rather than as evidence of validity by itself.
This style of reporting communicates considerably more methodological information than a bare coefficient, and it places reliability within the broader argument for the validity of score interpretation, rather than treating reliability as a self-contained, sufficient justification for using the scale (Oladunmoye, 2026a).
23. Toward Integrated Measurement Modelling
Psychometric software is moving increasingly toward integrated measurement modelling rather than isolated statistical calculations. A future reliability system might combine classical test theory, expressed as X equals T plus E; latent variable modelling, expressed as Xi equals lambda-i times F plus epsilon-i; item response theory, expressed as the conditional probability of a response given the trait level theta; generalisability theory, expressed through relative and absolute variance components; and Bayesian measurement models, which yield posterior distributions for parameters and for reliability itself, rather than single point estimates. The goal of such integration is not to eliminate the traditional coefficients reviewed in this note, but to place them within a broader and more coherent measurement framework.
For PsychtrixWeb specifically, this creates an opportunity to transform reliability analysis from a single statistical output into an integrated, intelligent measurement-diagnostic system. A comprehensive dashboard could present classical reliability statistics, including Cronbach's alpha, standardised alpha, and split-half reliability; model-based reliability statistics, including McDonald's omega, composite reliability, and hierarchical omega where appropriate; ordinal reliability statistics, including ordinal alpha and ordinal omega where supported by the data; precision statistics, including the standard error of measurement, conditional reliability, and item response theory information; diagnostic statistics, including item-total correlations, factor loadings, redundancy indices, and dimensionality checks; and reporting features, including tables formatted to the conventions of the American Psychological Association, automatically generated interpretive text, confidence intervals, and a reproducible analysis record. Researchers should be able to see not merely whether a scale is internally consistent, but why it is internally consistent, under which assumptions, for which score, and with what degree of measurement precision across the trait continuum.
24. Key Takeaways
- Cronbach's alpha remains useful but should not be treated as a universal reliability coefficient.
- McDonald's omega is particularly valuable when item factor loadings differ substantially.
- A high alpha coefficient does not, by itself, establish unidimensionality.
- A high reliability coefficient does not, by itself, establish validity.
- Adding items to a scale can increase alpha even when average item relationships weaken.
- Very high internal consistency can indicate item redundancy rather than excellent measurement.
- Ordinal response data may require specialised reliability approaches, such as polychoric or ordinal methods.
- Reliability estimates are dependent on the sample and the measurement model, not fixed properties of an instrument.
- Reliability should be evaluated alongside dimensionality and validity evidence, not in isolation.
- For advanced measurement, global reliability coefficients should be complemented by information about conditional measurement precision across the trait continuum.
25. Conclusion
Cronbach's alpha has played an important role in psychological and behavioural measurement for more than seventy years. However, its widespread and largely unreflective use has, in many areas of applied research, transformed it from a conditional statistical estimator into something closer to a ritualistic requirement of questionnaire research, reported because convention demands it rather than because its assumptions have been considered.
A contemporary psychometric approach should instead begin from a more fundamental question: what measurement model is appropriate for the scores that the researcher intends to interpret? If items are approximately tau-equivalent, alpha may provide a useful and sufficient estimate of internal consistency. If item loadings differ substantially, omega provides a more defensible, model-based estimate. Neither coefficient, however, should be interpreted in isolation from the wider measurement argument. A strong reliability argument requires joint consideration of dimensionality, the measurement model, reliability itself, validity, and measurement precision across the trait continuum.
For PsychtrixWeb, this analysis points toward an opportunity to transform reliability analysis from a single statistical output into an intelligent, measurement-diagnostic system. Researchers should be able to see not merely whether a scale is internally consistent, but why, under which assumptions, for which score, and with what degree of measurement precision. This represents a more defensible and more informative approach to psychological measurement than the routine, unreflective reporting of a single coefficient.
Recommended Citation
Oladunmoye, E. O. (2026). Cronbach's alpha vs. McDonald's omega: Which reliability coefficient should researchers report? PsychtrixWeb Research Notes, 007. Psychtrix Initiative Limited.
References
- Cronbach, L. J. (1951). Coefficient alpha and the internal structure of tests. Psychometrika, 16(3), 297 to 334. https://doi.org/10.1007/BF02310555
- Dunn, T. J., Baguley, T., and Brunsden, V. (2014). From alpha to omega: A practical solution to the pervasive problem of internal consistency estimation. British Journal of Psychology, 105(3), 399 to 412. https://doi.org/10.1111/bjop.12046
- Hayes, A. F., and Coutts, J. J. (2020). Use omega rather than Cronbach's alpha for estimating reliability. But... Communication Methods and Measures, 14(1), 1 to 24. https://doi.org/10.1080/19312458.2020.1718629
- McDonald, R. P. (1999). Test theory: A unified treatment. Lawrence Erlbaum Associates.
- McNeish, D. (2018). Thanks coefficient alpha, we'll take it from here. Psychological Methods, 23(3), 412 to 433. https://doi.org/10.1037/met0000144
- Raykov, T. (1997). Estimation of composite reliability for congeneric measures. Applied Psychological Measurement, 21(2), 173 to 184. https://doi.org/10.1177/01466216970212006
- Raykov, T., and Marcoulides, G. A. (2017). Thanks coefficient alpha, we still need you! Educational and Psychological Measurement, 77(2), 200 to 210. https://doi.org/10.1177/0013164416656980
- Revelle, W., and Condon, D. M. (2019). Reliability from alpha to omega: A tutorial. Psychological Assessment, 31(12), 1395 to 1411. https://doi.org/10.1037/pas0000754
- Revelle, W., and Zinbarg, R. E. (2009). Coefficients alpha, beta, omega and the glb: Comments on Sijtsma. Psychometrika, 74(1), 145 to 154. https://doi.org/10.1007/s11336-008-9102-z
- Sijtsma, K. (2009). On the use, the misuse, and the very limited usefulness of Cronbach's alpha. Psychometrika, 74(1), 107 to 120. https://doi.org/10.1007/s11336-008-9101-0
- Oladunmoye, E. O. (2026a). Validity in Psychological Assessment: Evidence, Interpretation, and Common Misconceptions. PsychtrixWeb Research Note, 005. Psychtrix Initiative Limited. https://www.psychtrixweb.online/research-notes/005-1-introduction.
- Oladunmoye, E. O. (2026b). Reliability in Psychological Measurement. PsychtrixWeb Research Note, 004. Psychtrix Initiative Limited. https://www.psychtrixweb.online/research-notes/004abstract-2
- Oladunmoye, E.O., Agbor, E.C., Olabisi, O.L., and Oyadeyi, J.B., (2024). Estimating measurement invariance on emotional intelligence scale across gender and age among undergraduates in Nigeria. Thinking Skills and Creativity Journal. 7(1),50-60
- Oladunmoye E.O (2025). Ultra-short scales in employee assessment: balancing efficiency and accuracy. Journal of Applied Sciences, Information and Computing.6(2),103-108.
- Oladunmoye, E.O., Oyedele, O. Leah, Enamudu, G.P., and Faith, Nakalema, (2024). Assessing Psychometric Tools in Online Education: Effectiveness and Obstacles in Virtual Learning Assessments. ISAR Journal of Arts, Humanities and Social Sciences, 2(12), 8-13.
Suggested citation
Oladunmoye, E. O. (2026). Cronbach's Alpha versus McDonald's Omega. PsychtrixWeb Research Note, 008. Psychtrix Initiative Limited. https://www.psychtrixweb.online/research-notes/008-abstract-4Discuss this Research Note
Scholarly comments are welcome from anyone — no account required. Contributions are moderated before they appear.
No comments yet. Start the scholarly discussion below.