
Exploratory Factor Analysis Versus Confirmatory Factor Analysis
When Should Researchers Explore and When Should They Confirm?
Abstract
Exploratory factor analysis (EFA) and confirmatory factor analysis (CFA) are among the most important statistical procedures used in the development and evaluation of psychological and behavioural measurement instruments. Although the two techniques are frequently discussed together, they answer fundamentally different questions. EFA is primarily concerned with discovering or evaluating plausible latent structures when the dimensionality of an item pool is uncertain, whereas CFA evaluates a prespecified measurement model against observed data. Confusing these two purposes can lead to overfitted models, inflated claims of validity, inappropriate item deletion, and weak replication. This Research Note explains the conceptual and statistical distinction between EFA and CFA and provides a practical workflow for deciding when each procedure should be used. Particular attention is given to factor retention, item cross loadings, factor interpretation, model specification, estimator selection, model fit, cross validation, sample splitting, measurement invariance, and the relationship between exploratory findings and confirmatory evidence. The note also demonstrates how an integrated psychometric platform such as PsychtrixWeb can support the transition from exploratory measurement development to confirmatory validation, and it illustrates the discussion with a worked example, comparative tables and summary figures. The central argument is that EFA and CFA should not be regarded as competing procedures. They are complementary components of a broader measurement development process. EFA helps researchers understand the empirical structure of an item pool, while CFA subsequently tests whether a theoretically specified structure is supported by new, or appropriately independent, evidence. A robust scale development programme typically moves from theory, through exploratory investigation and refinement, to confirmatory testing, reliability and validity evaluation, and replication. Keywords: exploratory factor analysis, confirmatory factor analysis, EFA, CFA, factor analysis, scale development, psychometrics, latent variables, structural validity, measurement invariance, PsychtrixWeb
1. Introduction
Suppose a researcher develops a thirty item questionnaire intended to measure Digital Resilience. The theoretical framework proposes four dimensions: adaptive coping, digital self regulation, recovery, and problem solving. The researcher collects responses from 500 participants. What should happen next?
A common response is: "run a confirmatory factor analysis." Another common response is: "run an exploratory factor analysis first." Both answers can be correct, depending on the status of the measurement model. The crucial question is not which technique is fashionable, but how certain the researcher can reasonably be about the dimensional structure before analysing the data.
If the researcher has a clearly specified and theoretically defensible measurement model, CFA may be appropriate. If the researcher is developing a new scale and does not yet know how the items organise themselves empirically, EFA may be appropriate. If the researcher instead uses EFA to discover a structure and then runs CFA on exactly the same data simply to confirm that structure, the resulting evidence is considerably weaker than genuine independent confirmation, because the confirmatory test is no longer independent of the exploratory decisions that produced the model.
Scale development literature therefore recommends distinguishing the exploratory development stage from the subsequent dimensionality validation stage. Boateng et al. (2018), for example, recommend testing dimensionality on a different time point or, ideally, an independent sample when developing and validating a scale. This Research Note develops that recommendation into a structured decision framework, situates it within current measurement standards, and considers its implications for platforms that support the full scale development lifecycle, such as PsychtrixWeb (Oladunmoye, 2026c).
1.1 Purpose and scope of this note
This note has three aims. First, it clarifies the conceptual and statistical differences between EFA and CFA, including their treatment of factor structure, estimation, and model evaluation. Second, it sets out a practical, stepwise workflow that researchers can use to decide when exploration is warranted and when confirmation is appropriate, including guidance on sample splitting, cross validation and measurement invariance. Third, it considers how a psychometric platform can operationalise this workflow so that exploratory and confirmatory analyses are treated as connected stages of a single measurement development pipeline rather than as unrelated statistical procedures.
2. The Fundamental Difference Between EFA and CFA
The simplest distinction between the two procedures is one of purpose. EFA asks: what factor structure could plausibly explain the observed relationships among these items? CFA asks: does this specified factor structure adequately represent the observed data? In shorthand, EFA corresponds to exploration and CFA corresponds to confirmation. However, this simplified distinction should not be interpreted as meaning that EFA is atheoretical or that CFA is entirely theory free. Both procedures require substantive judgement at every stage, from item selection through to the interpretation of the resulting model.
Feature | Exploratory Factor Analysis (EFA) | Confirmatory Factor Analysis (CFA) |
Guiding question | What structure could plausibly explain the data? | Does a specified structure fit the data? |
Model specification | Determined empirically; all items may load on all factors | Specified in advance by the researcher |
Typical use case | New scale, ambiguous theory, adapted instrument | Established theory, replication, group comparison |
Number of factors | Estimated from the data (parallel analysis, scree plot) | Fixed by the researcher prior to estimation |
Cross loadings | Freely estimated and inspected | Usually fixed to zero unless theoretically justified |
Output emphasis | Loading pattern, communalities, interpretability | Fit indices, standardised loadings, parameter significance |
Evidential strength | Descriptive; hypothesis generating | Evaluative; hypothesis testing |
Table 1. Summary comparison of exploratory and confirmatory factor analysis.
One useful way to think about the two procedures is that EFA is inductive, in that it moves from data towards structure, whereas CFA is deductive, in that it moves from a specified structure towards a test of that structure against data. Neither approach is inherently superior; the appropriate choice depends on what is already known about the construct and the instrument.
3. What Is a Latent Factor?
Psychological constructs such as anxiety, resilience, self esteem, psychological wellbeing, emotional intelligence, and academic motivation are often not directly observable. Instead, researchers observe indicators, such as item responses on a questionnaire, and infer the underlying construct from patterns of covariance among those indicators. For example, a construct such as resilience might be inferred from four indicator items, each of which is assumed to reflect the underlying latent variable to a greater or lesser degree (Oladunmoye, 2025).
Factor analysis, whether exploratory or confirmatory, provides a statistical framework for investigating these patterns of covariance and for estimating the strength of the relationship between each observed indicator and the underlying latent factor. The latent variable itself is never measured directly; it is a statistical abstraction that is useful to the extent that it accounts for the observed pattern of correlations among items in a parsimonious and theoretically meaningful way.
4. Why Factor Analysis Matters
Consider a pool of six items that a researcher initially assumes measure a single underlying construct. An exploratory analysis might instead reveal that the empirical structure supports two distinct factors, for example a factor labelled Psychological Recovery, defined by three items, and a separate factor labelled Digital Problem Solving, defined by the remaining three items. Such an analysis provides direct information about the dimensionality of the instrument, which has substantial implications for scoring, interpretation and subsequent validity evidence (Oladunmoye, 2026b).
Where an instrument is treated as unidimensional despite genuine multidimensionality, a single total score can obscure meaningful differences between subdomains, weaken predictive validity, and produce misleading estimates of internal consistency. Establishing the correct dimensional structure is therefore not a preliminary technicality; it is a substantive step that shapes every subsequent decision about how the instrument is used. Floyd and Widaman (1995) demonstrate this directly in the context of clinical assessment instruments, showing how factor analytic evidence guides the refinement of item pools and the interpretation of resulting scores.
5. EFA: The Exploratory Approach
EFA is particularly useful under a defined set of circumstances, and Fabrigar and Wegener (2012) provide one of the most widely used treatments of the technique and the judgement it requires. These include cases where a scale is newly developed, where the number of underlying dimensions is uncertain, where existing theory is incomplete, where items have been substantially modified, where an instrument has been adapted for a new population, or where previous research has produced inconsistent factor structures.
- The scale is newly developed and no established factor structure exists.
- The number of underlying dimensions is genuinely uncertain.
- Existing theory about the construct is incomplete or contested.
- Items have been substantially rewritten, added or removed.
- The instrument has been adapted for a new population or context.
- Previous studies report inconsistent factor structures for the same instrument.
EFA allows items to have non zero relationships with multiple factors rather than forcing every item to load exclusively on one predetermined factor. This flexibility is precisely what makes EFA valuable during instrument development, because it allows the empirical structure of the item pool to emerge rather than imposing an assumed structure prematurely.
5.1 EFA is not simply "running factor analysis"
A rigorous EFA involves a series of interlocking decisions, each of which can materially affect the resulting factor structure. Researchers must consider the type of factor analysis to be used, the appropriate correlation matrix, the extraction method, the number of factors to retain, the rotation method, the treatment of ordinal data, sample adequacy, item communalities, factor loadings, cross loadings, and the theoretical interpretability of the resulting solution.
Decision point | Typical options | Practical consideration |
Correlation matrix | Pearson, polychoric, tetrachoric | Polychoric correlations are generally preferred for ordinal Likert data |
Extraction method | Principal axis factoring, maximum likelihood, minimum residual | Maximum likelihood permits fit statistics and significance testing |
Factor retention | Kaiser criterion, scree plot, parallel analysis | Parallel analysis is generally the most defensible single method |
Rotation | Orthogonal (e.g. varimax), oblique (e.g. promax, oblimin) | Oblique rotation is usually more realistic for correlated psychological constructs |
Sample adequacy | Kaiser-Meyer-Olkin (KMO), Bartlett's test | KMO values above .80 are generally considered good |
Table 2. Key methodological decisions in a rigorous exploratory factor analysis.
Consequently, a manuscript statement such as "EFA was conducted" does not provide sufficient methodological information to permit a reproducible study. Each of the decisions summarised in Table 2 should be reported explicitly.
5.2 Principal components analysis is not the same as EFA
This distinction is frequently overlooked in applied research. Principal component analysis (PCA) and common factor analysis share a superficial resemblance but have different statistical objectives. PCA seeks to represent the total variance of the observed variables through a smaller number of components, whereas factor analysis seeks to model only the common variance that is attributable to underlying latent constructs, separating it from variance that is unique to each item. Because of this difference, PCA should not automatically be reported as exploratory factor analysis. Researchers developing psychological constructs should understand which model corresponds to their measurement objective, since the distinction becomes particularly important when writing a psychometric article intended for a measurement focused readership.
6. Choosing the Number of Factors
One of the most consequential decisions in EFA is how many factors should be retained. Historically, researchers often relied on the Kaiser criterion, which retains any factor with an eigenvalue greater than one. This rule should not, however, be treated as a universal decision rule, since it is known to over-extract factors under a range of realistic conditions.
Researchers can instead draw on several complementary sources of evidence: parallel analysis, the scree plot, the theoretical structure of the construct, the interpretability of candidate models, the residual structure, the pattern of factor loadings, and the substantive meaning of each candidate factor. Fabrigar and Wegener (2012) similarly caution against relying on any single retention rule and recommend triangulating parallel analysis with theoretical and interpretive evidence. Mokkink et al.'s (2010) COSMIN methodology, for example, considers structural validity in relation to factor loadings, cross loading, explained variance, and consistency with the theoretical construct, while also providing separate criteria for CFA and item response theory or Rasch based approaches.
6.1 Parallel analysis
Parallel analysis is particularly useful for factor retention decisions. The underlying logic proceeds in four steps: eigenvalues are calculated from the observed data; comparable eigenvalues are generated from randomly simulated data of the same dimensions; the observed and random eigenvalues are compared; and factors are retained where the observed eigenvalue exceeds the corresponding random eigenvalue. This comparison is generally more informative than reliance on the eigenvalue greater than one rule alone, because it accounts for the sampling variability that would be expected even in the complete absence of true underlying structure.
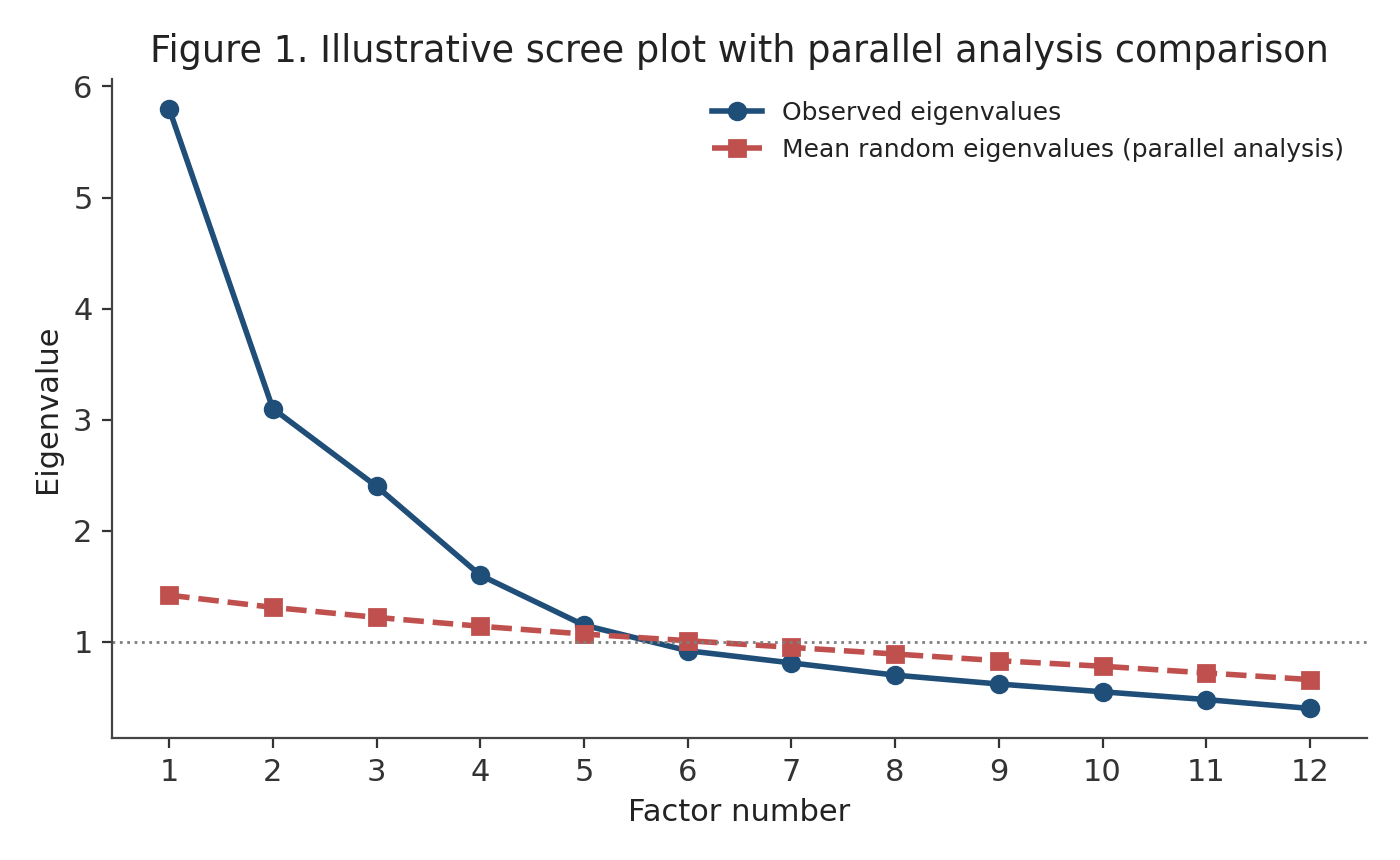
Figure 1. Illustrative scree plot with parallel analysis comparison. Factors whose observed eigenvalues exceed the mean random eigenvalue are candidates for retention; here, the first four factors clear this threshold.
6.2 The scree plot
The scree plot provides a visual representation of the eigenvalues associated with successive factors. Researchers look for the point at which a sharp decline in eigenvalues begins to level off, sometimes described informally as the elbow of the plot. However, scree plots involve a degree of subjective judgement and can be genuinely ambiguous in real data. Consequently, a strong factor retention decision should ideally integrate multiple sources of evidence, as summarised in Table 2, rather than relying on a single graphical rule.
7. Factor Rotation
When more than one factor is retained, researchers commonly rotate the factor solution to improve its interpretability. Two broad families of rotation are available. Under orthogonal rotation, of which varimax is the most common example, factors are constrained to be uncorrelated with one another. Under oblique rotation, of which promax and oblimin are common examples, factors are permitted to correlate freely.
For psychological constructs, oblique rotation is often the more substantively plausible choice, because psychological dimensions frequently correlate with one another in practice. For example, a correlation of approximately .58 between self regulation and recovery factors would not be unusual in a resilience related instrument, and there is generally no strong theoretical reason to assume that such dimensions must be completely independent of one another. Forcing orthogonality in such cases can distort the loading pattern and obscure genuine relationships among the underlying constructs.
8. Factor Loadings and Cross Loadings
A factor loading indicates the strength of association between an observed item and a latent factor within the estimated factor model. A clear structure is typically indicated when each item loads strongly on one factor and weakly on all others. Where an item instead shows a moderate loading on two or more factors, commonly termed a cross loading, the researcher should investigate whether the item is conceptually ambiguous, measures overlapping constructs, is poorly worded, or is genuinely multidimensional in content.
8.1 Do not delete items automatically
One of the more hazardous practices in scale development is the automatic application of a rule such as "delete every item with a loading below .50." Psychometric decisions of this kind should not be reduced to a single numerical threshold. An item may simultaneously show a moderate loading, strong theoretical relevance, and unique content coverage that is not represented elsewhere in the item pool. Deleting such an item may improve model statistics in the short term while weakening the substantive representation of the construct. A defensible decision instead integrates statistical evidence, theoretical relevance, content coverage, and interpretability, considered together rather than in isolation (Oladunmoye, Oyedele, Enamudu, & Nakalema, 2024).
9. What Is Confirmatory Factor Analysis?
Confirmatory factor analysis begins with a model that is specified before the fit of that model to the data is evaluated, a point developed extensively by Brown (2015) in what remains one of the standard applied references on the technique. For example, a two factor model might specify that four items load exclusively on a first latent factor and a further four items load exclusively on a second latent factor. The researcher specifies, in advance, which items belong to which factors, whether the factors are permitted to correlate, whether any residual correlations are theoretically justified, whether higher order factors exist, and whether any cross loadings are permitted. The observed data are then used to evaluate the adequacy of this proposed model, rather than to generate the model itself.
9.1 CFA as a model testing framework
CFA also allows competing theoretical models to be compared directly against one another. For instance, theory might propose a single general factor, a set of several correlated factors, a second order factor model in which a higher order construct accounts for correlations among lower order factors, or a bifactor model in which items load on both a general factor and a specific factor. CFA allows these candidate models to be compared, but the objective is not simply to identify the model with the smallest chi-square statistic. The researcher should instead ask whether the model fits the data adequately, whether the resulting structure is theoretically meaningful, whether the parameter estimates are sensible, whether the factors are sufficiently distinct from one another, whether the model is identifiable, whether the model is likely to replicate in new data, and whether the resulting score interpretation makes conceptual sense.
10. Model Fit in Confirmatory Factor Analysis
Common CFA fit statistics include the chi-square statistic, the Comparative Fit Index (CFI), the Tucker-Lewis Index (TLI; Tucker & Lewis, 1973), the Root Mean Square Error of Approximation (RMSEA), and the Standardised Root Mean Square Residual (SRMR). Kline (2023) provides a comprehensive treatment of these indices within the broader structural equation modelling framework and cautions against relying on any one statistic in isolation.
Fit index | Typical acceptable threshold | Interpretation |
CFI | Above .95 (acceptable above .90) | Improvement in fit relative to a null baseline model |
TLI | Above .95 (acceptable above .90) | Similar to CFI, with a penalty for model complexity |
RMSEA | Below .06 (acceptable below .08) | Approximate fit per degree of freedom, penalises complexity |
SRMR | Below .08 | Average standardised discrepancy between observed and model implied correlations |
Chi-square | Non-significant is desirable but rarely achieved with large samples | Test of exact fit; highly sensitive to sample size |
Table 3. Commonly reported CFA fit indices and illustrative thresholds. Thresholds should be treated as general guidance within a broader evaluation framework rather than as fixed pass or fail criteria.
The COSMIN methodology (Mokkink et al., 2010), for example, provides illustrative structural validity criteria for CFA, including CFI or TLI values above .95 and RMSEA below .06 or SRMR below .08. These figures should be understood as criteria within a particular evaluation framework, and not as universal laws that override theory or estimation considerations. A model should not be declared valid simply because its CFI exceeds .95; model fit is evidence about the adequacy of a specified model, not proof that a psychological construct has been completely validated.
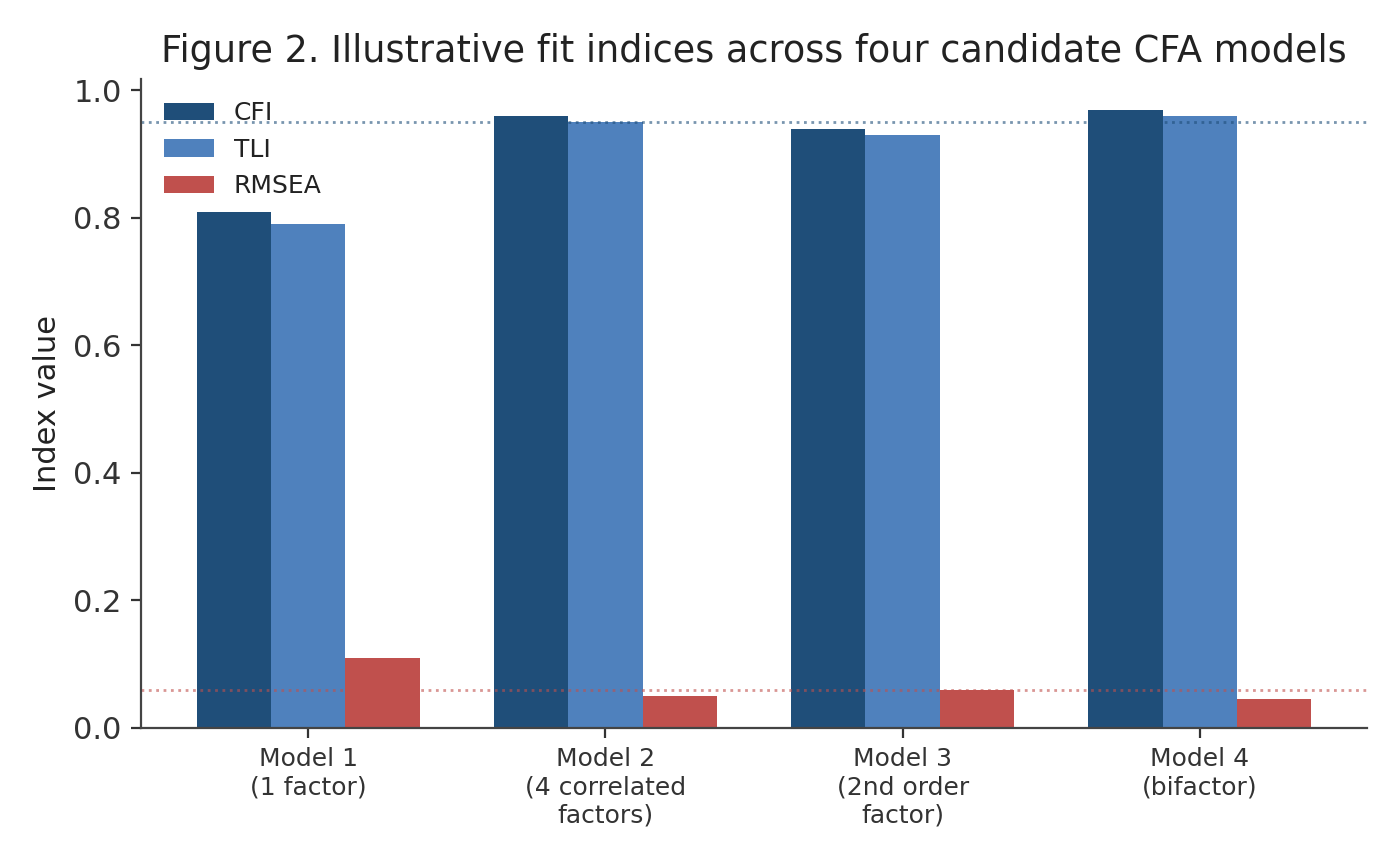
Figure 2. Illustrative fit indices across four candidate confirmatory models. Models 2 and 4 meet conventional CFI and TLI thresholds and fall below the RMSEA guideline, whereas Model 1 shows clear misfit.
10.1 Chi-square and sample size
The chi-square test evaluates exact model fit. However, with large samples, relatively small discrepancies between the specified model and the observed covariance structure can become statistically significant even when those discrepancies are substantively trivial. A significant chi-square result does not automatically mean that the confirmatory analysis has failed, and conversely a non-significant chi-square result does not automatically establish excellent measurement. Researchers should interpret the chi-square statistic together with approximate fit measures, parameter estimates, relevant theory, and residual diagnostics, rather than relying on any single statistic in isolation.
11. EFA and CFA Should Often Use Different Evidence
This is one of the most important principles in scale development. Suppose a sample of 500 participants is used to conduct an EFA, which produces a four factor structure. If a CFA is then conducted on exactly the same 500 participants and produces an excellent fit, this is not equivalent to conducting the EFA on one sample and then testing the resulting four factor structure through a CFA on an independent second sample. The second approach provides substantially stronger evidence, because the confirmatory test is not being conducted on the same observations that informed the exploratory decisions in the first place. Boateng et al. (2018) specifically recommend using an independent sample, where feasible, for testing dimensionality after scale development.
11.1 What if only one sample is available?
This situation is common in student research and in smaller studies with limited resources. In such cases, researchers may split the available sample, for example dividing a sample of 600 participants at random into two subsamples of 300 participants each. The first subsample is then used for EFA and the second subsample is used for CFA. This approach is preferable to presenting a CFA as genuinely independent confirmation when the same observations were in fact used to develop the model. However, sample splitting reduces the effective sample size available for each individual analysis, and independent replication in an entirely new study can therefore provide stronger evidence than merely splitting a single existing sample (Oladunmoye, Oyedele, Sa’ad, & Nakalema, 2024).
12. EFA to CFA as a Developmental Sequence
The ideal logic of a scale development programme proceeds from theory, through item generation and pilot data collection, to exploratory factor analysis and subsequent model refinement, followed by data collection from an independent sample, confirmatory factor analysis, evaluation of reliability and validity, and finally replication. This sequence is considerably more scientifically defensible than an approach in which data are subjected directly to CFA and items are then deleted repeatedly until an acceptable fit is achieved.
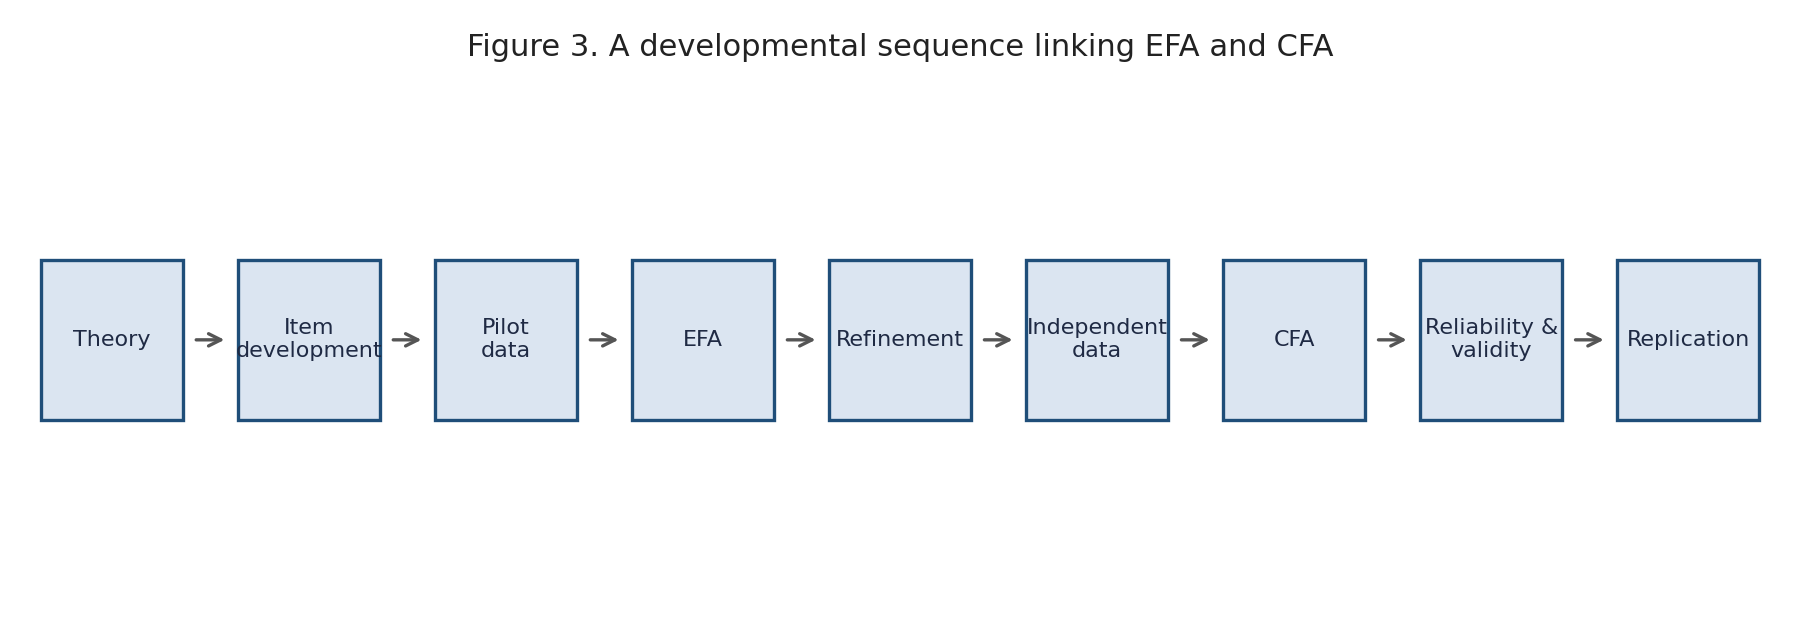
Figure 3. A developmental sequence linking exploratory and confirmatory factor analysis within a broader scale development programme.
13. When CFA Can Be Used Without a Prior EFA
Researchers should not assume that EFA must always precede CFA. CFA can be entirely appropriate where an established theoretical model already exists, where a previously validated instrument is being replicated, where previous studies have consistently supported a particular structure, where a researcher is testing a clearly specified measurement hypothesis, or where an existing instrument with an established structure is being evaluated in a new population. For example, if a widely studied scale has consistently demonstrated a four factor structure across many independent samples, CFA may be more appropriate than conducting a further exploratory analysis merely because new data have become available.
14. When EFA Is Particularly Valuable
EFA becomes especially valuable under several circumstances: when developing a new instrument for which the structure is genuinely unknown; when substantially adapting an existing instrument, since items may behave differently after adaptation; when working in a different cultural context, since the original dimensional structure may not automatically generalise; when revising an item pool, since new or modified items may alter the underlying dimensionality; and when the existing literature reports inconsistent structures across different studies. In each of these situations, the researcher should explore the empirical structure of the data before making strong confirmatory claims about it.
15. CFA After Translation or Cultural Adaptation
Suppose an English language scale is translated into another language for use in a different cultural context. The researcher should not simply assume that the original confirmatory factor structure will transfer unchanged to the translated instrument. Translation can affect semantic meaning, response interpretation, cultural relevance, item difficulty, factor loadings, and residual relationships among items. The COSMIN framework (Mokkink et al., 2010) explicitly treats cross-cultural validity and structural validity as important and distinct measurement considerations, and its overall framework emphasises matching the measurement property analysis to the specific research question and instrument under consideration. Translated instruments will therefore often require new psychometric evidence rather than an assumption of automatic equivalence with the original version (Oladunmoye, Agbor, Olabisi, & Oyadeyi, 2024; Oladunmoye & Muhammad, 2024).
16. Ordinal Likert Data
Many psychological questionnaires use four point, five point, or seven point Likert response categories, which are ordinal rather than continuous in a strict statistical sense. Researchers should consider carefully whether treating such data as continuous is appropriate for a particular analysis. Estimator selection matters considerably in this context. For ordinal indicators, CFA may be conducted using estimators specifically designed for categorical or ordinal data, with the appropriate choice depending on the software environment, the specified model, and the characteristics of the data at hand; widely used structural equation modelling software such as Mplus (Muthen & Muthen, 1998 to 2017) offers several such estimators for categorical and ordinal indicators. A sophisticated psychometric platform should therefore avoid forcing every dataset into a single default estimator regardless of its measurement level.
17. A Practical PsychtrixWeb EFA Workflow
An integrated psychometric platform can operationalise the methodological principles described above as a structured, reproducible workflow. A practical PsychtrixWeb EFA workflow could proceed through the following fourteen steps.
Step | EFA workflow action |
1 | Upload the dataset. |
2 | Select the questionnaire items to be analysed. |
3 | Define the response scale for the items. |
4 | Identify the approach to missing data handling. |
5 | Select a correlation method appropriate to the data. |
6 | Evaluate the factorability of the correlation matrix. |
7 | Run parallel analysis to inform factor retention. |
8 | Inspect the scree plot. |
9 | Specify candidate factor solutions. |
10 | Compare rotated solutions across candidate models. |
11 | Inspect loadings and cross loadings for each solution. |
12 | Review the theoretical interpretation of each candidate factor. |
13 | Document all item level decisions. |
14 | Save the exploratory model as a versioned analysis object. |
Table 9. A fourteen step PsychtrixWeb EFA workflow, producing a reproducible exploratory analysis with every decision captured alongside the resulting model.
18. A Practical PsychtrixWeb CFA Workflow
The corresponding CFA workflow should be deliberately different in character, since it begins from a specified model rather than from an open exploration of the data (Oladunmoye, 2026a).
Step | CFA workflow action |
1 | Define the theoretical model. |
2 | Map items to their specified latent factors. |
3 | Choose an estimator appropriate to the measurement level of the data. |
4 | Estimate the specified model. |
5 | Inspect overall model fit. |
6 | Inspect standardised factor loadings. |
7 | Inspect factor correlations. |
8 | Inspect residual diagnostics. |
9 | Evaluate any theoretically justified model modifications. |
10 | Compare alternative models where relevant. |
11 | Evaluate reliability at the factor level. |
12 | Evaluate validity evidence. |
13 | Save the final measurement model as a versioned analysis object. |
Table 10. A thirteen step PsychtrixWeb CFA workflow, kept deliberately distinct from the EFA workflow so the two procedures are not reduced to interchangeable buttons in a single interface.
18.1 A visual model builder
A particularly useful platform feature is a visual confirmatory model builder, in which a researcher can represent a latent construct such as Digital Resilience together with its constituent first order factors, for example Adaptive Coping, Recovery and Self Regulation, and the specific items associated with each factor. The researcher should be able to drag items between factors, create new latent variables, add or remove structural paths, define correlated factors, define second order factors, inspect standardised estimates directly on the diagram, and save distinct model versions for comparison. Such a tool bridges formal statistical modelling and the substantive conceptual reasoning that should underpin every measurement model.
19. Modification Indices: Use With Caution
CFA software may provide modification indices, which identify parameters that, if freely estimated, would be expected to improve model fit, for example by allowing a residual correlation between two specific items. The danger inherent in this feature is data driven model fishing. If a researcher repeatedly modifies a model until the fit indices become attractive, the resulting final model may be substantially overfitted to the idiosyncrasies of the particular sample. A sound guiding principle is that a model should be modified when there is a clear substantive reason for the modification, and not merely because a piece of software has recommended it.
20. The Problem of Overfitting
Consider a researcher who conducts an initial CFA, inspects the modification indices, adds a path, re-estimates the model, adds a residual correlation, re-estimates again, deletes an item, re-estimates once more, and then adds a further residual correlation. Eventually the model may achieve an extremely attractive fit statistic, for example a CFI of .99. However, a model refined through this process may be highly specific to the particular dataset used to develop it. The genuine test of a measurement model is whether it continues to perform adequately with new data; an attractive fit statistic in the original sample does not guarantee replication, and good fit should never be equated with guaranteed replication.
21. Cross Validation
Cross validation directly addresses the overfitting problem described above. A model developed using one dataset is evaluated using an entirely separate dataset; if the model performs adequately in both the development sample and the validation sample, confidence in its generalisability increases substantially. This principle is particularly important in cases where the model has undergone extensive exploratory or data driven modification during its development.
22. EFA, CFA and Measurement Invariance
CFA becomes even more important when researchers wish to compare groups, for example undergraduate and postgraduate students who have both completed a Digital Wellbeing scale. In such cases, the researcher may ask whether the same measurement model genuinely operates in both groups, which leads to the concept of measurement invariance.
Level of invariance | What is held equal across groups | Substantive implication if supported |
Configural invariance | Same pattern of factors and items across groups | The same general structure applies in each group |
Metric invariance | Factor loadings held equal across groups | Item relationships with the factor are comparable across groups |
Scalar invariance | Item intercepts held equal in addition to loadings | Latent mean comparisons across groups become meaningful |
Strict invariance | Residual variances held equal in addition to the above | Item level measurement error is comparable across groups |
Table 4. The typical sequence of measurement invariance testing in confirmatory factor analysis.
CFA is therefore not simply a scale validation procedure considered in isolation; it is also foundational for many sophisticated group comparison analyses that depend on establishing that a measurement model operates equivalently across the groups being compared.
23. EFA and CFA in Cross-Cultural Research
Cross-cultural measurement presents an especially important challenge. Suppose a four factor solution emerges in one country and a three factor solution emerges in another country using the same nominal instrument. There are several possible explanations for such a discrepancy, including genuine cultural differences in how the construct is expressed, translation effects, differences in item interpretation, sampling differences, model misspecification, and genuine measurement non-invariance. EFA may help identify possible structural differences between the two contexts, while CFA and formal invariance analysis can then test specific hypotheses about the degree of comparability between them.
24. EFA and CFA Are Not Validity in Themselves
This distinction is critical for accurate scientific reporting. A researcher might report that a CFA showed good model fit and therefore conclude that the instrument is valid; this conclusion is generally too strong. Factor structure provides evidence concerning structural validity specifically, but it does not by itself establish every other aspect of validity. A broader validity argument may additionally require evidence concerning content, response processes, internal structure, relationships with other relevant variables, the consequences of score interpretation and use, and the population and context within which the instrument is applied. The COSMIN framework (Mokkink et al., 2010) similarly treats structural validity as one measurement property among several, rather than equating it with overall instrument validity. The Standards for Educational and Psychological Testing (AERA, APA, & NCME, 2014) likewise identify several distinct sources of validity evidence, including evidence based on test content, response processes, internal structure, relationships with other variables, and the consequences of testing, and structural validity as evaluated through CFA corresponds most directly to only one of these sources.
25. Factor Structure and Reliability
Researchers should establish dimensionality before interpreting internal consistency estimates too broadly. Suppose an overall Cronbach alpha of .93 is reported for a full item set, while an EFA reveals three distinct underlying factors. The overall alpha statistic in this situation may conceal genuine multidimensionality in the data. A more appropriate approach is generally to report separate reliability estimates for each factor and to consider explicitly whether a single total score across the entire instrument is defensible given the underlying structure. Internal consistency is therefore closely connected to, and should be interpreted in light of, the established dimensionality of the instrument.
26. Reporting EFA and CFA in a Research Article
Comprehensive methodological reporting is essential for reproducibility and for allowing readers to evaluate the strength of the resulting evidence. Table 5 summarises the elements that a strong report of each procedure should include.
Reporting element | EFA report should specify | CFA report should specify |
Sample | Sample size and characteristics | Sample size and characteristics |
Method | Extraction and correlation method | Estimator and model specification |
Structure decisions | Factor retention procedure and rotation method | Whether the model is prespecified, adapted, or derived from prior EFA |
Results | Number of retained factors, loadings, cross loadings, communalities | Fit statistics, standardised loadings, factor correlations |
Diagnostics | Item deletion decisions and rationale | Residual diagnostics and any modifications made |
Interpretation | Theoretical interpretation of the retained structure | Theoretical justification for the specified or modified model |
Downstream evidence | Not applicable at this stage | Reliability and validity evidence associated with the final model |
Table 5. Recommended elements of a comprehensive EFA and CFA report.
Worthington and Whittaker (2006) reach a similar conclusion in their content analysis of published scale development studies, finding that many reports omit key methodological details such as the extraction method, the retention procedure, and the rationale for item deletion. A statement such as "EFA was conducted and three factors emerged" is inadequate for high quality methodological reporting, since it omits nearly every element listed in Table 5. Researchers should also make explicit whether a confirmatory model was prespecified on theoretical grounds, adapted from previous research, derived directly from a prior EFA, or modified after examining the current dataset, since this distinction materially affects how readers should interpret the resulting evidence.
27. A Practical Example: The Psychological Digital Resilience Scale
The following illustrative example traces a complete measurement development pathway for a hypothetical instrument, the Psychological Digital Resilience Scale, beginning with an initial item pool of forty items distributed across four theoretical domains: adaptive coping, emotional recovery, self regulation, and problem solving.
Phase | Activity | Outcome |
1 | Expert review of the initial item pool | Pool reduced from 40 to 36 items |
2 | Collection of pilot data | Dataset available for exploratory analysis |
3 | Exploratory factor analysis | Four factor structure identified |
4 | Review of cross loading items | Three of five flagged items removed after content review |
5 | Evaluation of remaining item pool | 33 items retained for further testing |
6 | Collection of an independent sample | New dataset available for confirmatory testing |
7 | Confirmatory factor analysis | Four factor structure tested against independent data |
8 | Comparison of alternative models | Correlated four factor model preferred over competing models |
9 | Reliability and validity evaluation | Factor level reliability and convergent evidence established |
10 | Measurement invariance testing across gender | Metric invariance supported across groups |
Table 6. A ten phase measurement development pathway for the illustrative Psychological Digital Resilience Scale.
This staged pathway is substantially stronger than an approach involving a single CFA conducted on a convenience sample, with its fit indices reported in isolation, since it incorporates independent confirmatory evidence, an explicit rationale for item level decisions, and a formal evaluation of measurement invariance.
28. An EFA to CFA Decision Matrix
Table 7 summarises the decision framework developed throughout this note in a single reference matrix, linking common research situations to the generally recommended analytic approach.
Research situation | Structure known in advance? | Recommended approach |
Brand new instrument | No | EFA on pilot or development sample, followed by independent CFA |
Substantially revised item pool | No | EFA to re-examine structure before further confirmatory testing |
Established instrument, new population | Yes, tentatively | CFA, with EFA as a fallback if fit is poor |
Established instrument, same population | Yes | CFA, potentially extended to measurement invariance testing |
Translated or culturally adapted instrument | Uncertain | EFA or CFA depending on prior adaptation evidence, with invariance testing where feasible |
Group comparison intended | Yes | CFA with formal measurement invariance testing |
Inconsistent prior findings in the literature | No | EFA to clarify structure before any confirmatory claim |
Table 7. An EFA to CFA decision matrix linking common research situations to a recommended analytic approach.
29. The Psychometric Researcher as Decision Maker
Statistical software should not decide the measurement model automatically on behalf of the researcher. Instead, a platform such as PsychtrixWeb should support the researcher through a structured sequence that moves from evidence, to diagnostics, to alternative models, to theoretical interpretation, and finally to a considered decision. For example, if a platform reports that a particular item loads .42 on one factor and .39 on a second factor, the software should not simply instruct the researcher to delete that item. A more appropriate recommendation is that the item demonstrates potential cross loading, and that its conceptual specificity and wording should be reviewed before deciding whether to retain, revise, or remove it. This distinction captures the difference between automated computation and genuine psychometric intelligence.
30. A Future AI-Assisted EFA and CFA System
A future PsychtrixWeb architecture could incorporate an artificial intelligence based methodological assistant capable of explaining, rather than merely executing, statistical procedures. For example, in response to a researcher question about why a particular item is problematic, such a system might explain that the item demonstrates substantial loadings on two factors, that its content appears conceptually related to both of the associated constructs, and that the researcher should consider reviewing the wording and theoretical assignment of the item before any decision to delete it. Such a system could also flag unusually high factor correlations, weakly defined factors, potential item redundancy, unstable factor solutions across alternative extraction methods, suspicious residual correlations, possible overfitting, and meaningful differences between exploratory and confirmatory structures for the same instrument. In each case, the guiding principle should be that the system explains its findings rather than simply executing a predetermined rule.
31. The PsychtrixWeb EFA and CFA Audit Trail
For reproducibility, each analysis conducted on the platform should preserve a complete audit trail, including the dataset version, the item version, the specific analysis settings used, the extraction method, the rotation method, the factor retention method, the model specification, any subsequent item changes, and the resulting final model. This creates a coherent analytical history, for example a sequence such as an initial exploratory model, a revised exploratory model, an initial confirmatory model, a revised confirmatory model, and a final accepted model. Such versioning is particularly useful in the context of thesis supervision, collaborative research teams, and journal submission, where reviewers frequently request a detailed account of how a final measurement model was reached.
32. Common Mistakes to Avoid
Drawing together the discussion above, researchers should be alert to a set of recurring mistakes in applied factor analytic practice.
No. | Common mistake |
1 | Using principal component analysis and reporting it as exploratory factor analysis. |
2 | Choosing the number of factors solely on the basis of eigenvalues greater than one. |
3 | Deleting items solely because of a numerical loading threshold, without theoretical consideration. |
4 | Using the same dataset for extensive exploratory driven modification and presenting a subsequent CFA as independent confirmation. |
5 | Using modification indices without a clear substantive or theoretical justification. |
6 | Treating a good CFA fit statistic as proof of complete instrument validity. |
7 | Ignoring meaningful cross loadings when interpreting a factor solution. |
8 | Ignoring substantial factor correlations when interpreting a multidimensional structure. |
9 | Reporting only CFI and RMSEA values without any explanation of the underlying model. |
10 | Comparing latent means across groups without first establishing adequate measurement invariance. |
Table 11. Ten recurring mistakes in applied exploratory and confirmatory factor analysis.
33. Towards a More Defensible Research Workflow
A robust measurement development workflow can be summarised as a sequence that begins with theory and construct definition, proceeds through item development and content evaluation, is followed by pilot data collection and exploratory factor analysis, continues with item and model refinement based on independent data, proceeds to confirmatory factor analysis, and concludes with reliability evaluation, validity evaluation, measurement invariance testing, differential item functioning or item response theory analysis where appropriate, and independent replication. This workflow integrates naturally with the broader psychometric architecture described in the preceding PsychtrixWeb Research Note in this series.
34. A Deeper Principle: Exploration and Confirmation as Different Forms of Evidence
The fundamental methodological distinction underlying this entire discussion can be expressed concisely: exploration is not the same as confirmation. EFA helps to answer the question of what structure might plausibly exist within a set of items. CFA helps to answer the separate question of how well a specified structure reproduces the observed data. Replication addresses a third and equally important question, namely whether a given structure continues to perform adequately when tested against new evidence. These represent three distinct epistemic questions, and a strong psychometric research programme should ultimately address all three rather than treating any single analysis as sufficient on its own.
35. Implications for PsychtrixWeb
The exploratory and confirmatory modules within an integrated psychometric platform should not be designed as two unrelated statistical buttons. They should instead form a single connected workflow, organised around five linked functions.
Module | Primary function | Representative outputs |
EFA module | Discover candidate structure | Factor count, loading pattern, cross loadings |
CFA module | Test a specified structure | Model fit, competing model comparisons, factor relationships |
Validation module | Evaluate reliability and validity | Reliability estimates, convergent and discriminant evidence, invariance results |
IRT / DIF module | Diagnose item level functioning | Item precision, group related item behaviour |
Reporting module | Communicate results transparently | Tables in standard reporting format, figures, methodological narrative, reproducibility information |
Table 8. A connected, five module architecture linking exploratory and confirmatory analysis within an integrated psychometric platform.
Structured in this way, the platform creates an integrated measurement development ecosystem, in which the outputs of one module feed naturally and transparently into the next, and in which the complete history of a measurement model, from initial item pool to final validated instrument, is preserved and available for inspection.
36. Conclusion
Exploratory factor analysis and confirmatory factor analysis are complementary rather than competing approaches to psychological measurement. EFA is most useful when researchers need to investigate uncertain dimensionality, evaluate newly developed item pools, or explore structural patterns that are not yet sufficiently established in the literature. CFA is most useful when researchers hold a theoretically specified measurement model and wish to evaluate whether that proposed structure is genuinely supported by observed data, ideally data that are independent of whatever process generated the model in the first place.
The strongest scale development workflow generally involves a sequence from theory, through EFA, through refinement, to an independent CFA, and finally to replication. However, EFA should not be treated as a mandatory precursor to every CFA, and a good CFA fit statistic should never be interpreted as proof of complete instrument validity. The quality of a psychometric study ultimately depends on the alignment between the research question, the underlying measurement theory, the characteristics of the available data, the specified statistical model, the interpretation offered by the researcher, and the extent to which the resulting structure has been replicated.
For PsychtrixWeb, this distinction carries important practical implications. The platform can move beyond providing isolated factor analytic procedures towards an integrated explore to confirm psychometric workflow, in which researchers can document precisely how a questionnaire evolves from an initial item pool into a theoretically interpretable and empirically supported measurement model. The ultimate objective is not to obtain the most visually attractive factor analytic output, but to establish a measurement structure that is theoretically defensible, empirically supported, transparent, reproducible, and genuinely useful for the intended population and purpose.
Recommended Citation
Oladunmoye, E. O. (2026). Exploratory factor analysis versus confirmatory factor analysis: When should researchers explore and when should they confirm? PsychtrixWeb Research Notes, 6. Psychtrix Initiative Limited.
References
- American Educational Research Association, American Psychological Association, & National Council on Measurement in Education. (2014). Standards for educational and psychological testing. American Educational Research Association.
- Boateng, G. O., Neilands, T. B., Frongillo, E. A., Melgar-Quinonez, H. R., & Young, S. L. (2018). Best practices for developing and validating scales for health, social, and behavioral research: A primer. Frontiers in Public Health, 6, Article 149. https://doi.org/10.3389/fpubh.2018.00149
- Brown, T. A. (2015). Confirmatory factor analysis for applied research (2nd ed.). Guilford Press.
- Fabrigar, L. R., & Wegener, D. T. (2012). Exploratory factor analysis. Oxford University Press.
- Floyd, F. J., & Widaman, K. F. (1995). Factor analysis in the development and refinement of clinical assessment instruments. Psychological Assessment, 7(3), 286 to 299. https://doi.org/10.1037/1040-3590.7.3.286
- Kline, R. B. (2023). Principles and practice of structural equation modeling (5th ed.). Guilford Press.
- Mokkink, L. B., Terwee, C. B., Patrick, D. L., Alonso, J., Stratford, P. W., Knol, D. L., Bouter, L. M., & de Vet, H. C. W. (2010). The COSMIN checklist for assessing the methodological quality of studies on measurement properties of health status measurement instruments: An international Delphi study. Quality of Life Research, 19, 539 to 549. https://doi.org/10.1007/s11136-010-9606-8
- Muthen, L. K., & Muthen, B. O. (1998 to 2017). Mplus user's guide (8th ed.). Muthen & Muthen.
- Oladunmoye E.O (2025). Ultra-short scales in employee assessment: balancing efficiency and accuracy. Journal of Applied Sciences, Information and Computing.6(2),103-108.
- Oladunmoye, E. O. (2026b). Validity in Psychological Assessment: Evidence, Interpretation, and Common Misconceptions. PsychtrixWeb Research Note, 005. Psychtrix Initiative Limited. https://www.psychtrixweb.online/research-notes/005-1-introduction.
- Oladunmoye, E. O. (2026c). Reliability in Psychological Measurement. PsychtrixWeb Research Note, 004. Psychtrix Initiative Limited. https://www.psychtrixweb.online/research-notes/004abstract-2
- Oladunmoye, E. O.(2026a). From Questionnaire to Validated Instrument: A Complete Psychometric Analysis Workflow Using PsychtrixWeb. PsychtrixWeb Research Note, 006. Psychtrix Initiative Limited. https://www.psychtrixweb.online/research-notes/006-1-introduction-2
- Oladunmoye, E. O., Muhammad T. S., (2024). Development and Validation of Multiple Intelligence Test among emerging adults in the United Kingdom. ISAR Journal of Arts, Humanities and Social Sciences, 2(4), 18-24.
- Oladunmoye, E.O., Agbor, E.C., Olabisi, O.L., and Oyadeyi, J.B., (2024). Estimating measurement invariance on emotional intelligence scale across gender and age among undergraduates in Nigeria. Thinking Skills and Creativity Journal. 7(1),50-60
- Oladunmoye, E.O., Oyedele, O. Leah, Enamudu, G.P., and Faith, Nakalema, (2024). Assessing Psychometric Tools in Online Education: Effectiveness and Obstacles in Virtual Learning Assessments. ISAR Journal of Arts, Humanities and Social Sciences, 2(12), 8-13.
- Oladunmoye, E.O., Oyedele, O. Leah, Sa’ad, M.T., and Faith, Nakalema, (2024). Ethical Considerations in High-Stakes Academic Assessments:Insights from the Nigerian Educational System. International Journal of Academic Multidisciplinary Research (IJAMR), 8(10), 101-108.
- Tucker, L. R., & Lewis, C. (1973). A reliability coefficient for maximum likelihood factor analysis. Psychometrika, 38, 1 to 10. https://doi.org/10.1007/BF02291170
- Worthington, R. L., & Whittaker, T. A. (2006). Scale development research: A content analysis and recommendations for best practices. The Counseling Psychologist, 34(6), 806 to 838. https://doi.org/10.1177/0011000006288127.
Suggested citation
PhD, E. O. O. (2026). Exploratory Factor Analysis Versus Confirmatory Factor Analysis. PsychtrixWeb Research Note, 007. Psychtrix Initiative Limited. https://www.psychtrixweb.online/research-notes/007-abstract-3Discuss this Research Note
Scholarly comments are welcome from anyone — no account required. Contributions are moderated before they appear.
No comments yet. Start the scholarly discussion below.