
From Questionnaire to Validated Instrument: A Complete Psychometric Analysis Workflow Using PsychtrixWeb
Abstract
A questionnaire is not automatically a psychological measurement instrument simply because it contains well written items and produces numerical scores. Transforming a questionnaire into a defensible measurement instrument requires a systematic sequence of conceptual, empirical, and psychometric evaluations. This Research Note presents an integrated workflow for analysing psychological and behavioural questionnaires using a modern psychometric framework, and demonstrates how such a workflow can be operationalised within PsychtrixWeb, an emerging psychometric analysis environment. The proposed workflow begins with construct specification and questionnaire architecture, followed by demographic variable identification, data screening, item level analysis, classical test theory, exploratory factor analysis, confirmatory factor analysis, reliability estimation, validity assessment, measurement invariance, differential item functioning, and advanced item response analysis. Particular attention is given to the distinction between constructs and subconstructs, because many contemporary questionnaires are multidimensional rather than representing a single homogeneous scale. The article also discusses why researchers should not rely exclusively on Cronbach's alpha, why factor analysis should be theoretically informed, why exploratory and confirmatory analyses should ideally be separated, and why demographic variables should be integrated into psychometric evaluation rather than treated solely as descriptive characteristics. The note proposes PsychtrixWeb as a unified psychometric analysis environment in which researchers can move from raw questionnaire data to an auditable evidence base concerning the quality, structure, precision, comparability, and interpretation of scores. Worked illustrations, evidence dashboards, and a proposed decision sequence are used to demonstrate how the workflow can be applied in practice. The framework is intended to support researchers, students, psychologists, assessment specialists, and methodological scholars in developing more transparent and reproducible measurement practices.
PsychtrixWeb Research Note 005
1. Introduction
Questionnaires are among the most frequently used data collection instruments in psychology, education, health research, organisational research, and the wider behavioural sciences. Their popularity rests on practical strengths: they are comparatively inexpensive to administer, they can be delivered to large samples, and they allow abstract psychological attributes, such as resilience, motivation, wellbeing, or self efficacy, to be expressed as numerical scores that can be analysed statistically.
A typical researcher may develop a questionnaire containing demographic questions, several constructs, multiple subconstructs, Likert type items, outcome variables, predictor variables, and mediating or moderating variables, so that the resulting dataset may contain dozens, or even hundreds, of variables. At this point an important methodological question emerges: how should a researcher determine whether the questionnaire actually functions as a sound measurement instrument? The answer cannot be obtained from a single statistic, and a questionnaire may produce data without producing defensible measurements.
Consider a hypothetical 30 item psychological questionnaire that returns a Cronbach's alpha of .92, statistically significant correlations with related variables, and apparently acceptable descriptive statistics. On the surface this instrument looks satisfactory. Yet the same questionnaire could still contain poorly functioning items, multiple unintended dimensions, redundant items, inadequate construct coverage, cross loading items, differential item functioning, and measurement non-invariance across groups, none of which would necessarily be visible from alpha, significance testing, or descriptive statistics alone.
The Standards for Educational and Psychological Testing place validity, reliability, fairness, appropriate score interpretation, and responsible test use at the centre of psychological and educational measurement. Jointly produced by the American Educational Research Association, the American Psychological Association, and the National Council on Measurement in Education, the Standards remain the most widely cited professional reference for measurement quality in the behavioural sciences (American Educational Research Association et al., 2014). Consequently, psychometric analysis should be viewed not as a single procedure but as an evidence building workflow, a coordinated sequence of conceptual, empirical, and statistical steps whose cumulative output is a body of evidence concerning what a set of scores means and how far that meaning can be trusted. This Research Note develops such a workflow, and shows how it can be implemented as a coherent analytic pipeline within PsychtrixWeb.
2. From Questionnaire to Measurement Instrument
The distinction between a questionnaire and a measurement instrument is fundamental to everything that follows in this Research Note. A questionnaire is, in the simplest sense, a collection of questions or statements used to collect information; nothing about that definition guarantees that the resulting scores measure anything in a defensible, reproducible way. A measurement instrument requires a stronger evidential foundation (Oladunmoye 2026a; Oladunmoye, 2026b). The researcher must be able to establish that the items represent the intended construct, that respondents understand the items appropriately, that the items demonstrate an interpretable structure, that scores possess adequate reliability or precision, that relationships with other variables conform to theoretical expectations, and that scores can be interpreted appropriately for the intended population (Oladunmoye, Oyedele, Enamudu, & Nakalema, 2024).
This can be understood as a progression: a questionnaire (a set of items exists) gives way to psychometric evaluation (items behave as intended), which in turn produces measurement evidence (scores prove reliable and valid), and finally a validated instrument (scores can be interpreted with confidence on the strength of a documented, converging evidence base). This progression is consistent with established approaches to scale development. Boateng, Neilands, Frongillo, Melgar-Quinonez, and Young (2018), for example, describe scale development as a multistage process spanning item development, scale construction, and scale evaluation, each comprising several discrete steps, rather than a single statistical test performed once the data have been collected. An important implication follows: a researcher who reports only a reliability coefficient, however impressive, has not yet demonstrated that a questionnaire functions as a measurement instrument. Reliability is a necessary but insufficient condition, and the remainder of this Research Note is organised around the sequence of analyses that, taken together, provide the evidential foundation required to make that stronger claim.
3. The Psychometric Analysis Architecture
A comprehensive psychometric workflow can be represented as an ordered sequence of analytic stages, moving from study definition through to a final psychometric report. Table 2 sets out this architecture in the order in which the stages are typically encountered in practice, although, as discussed below, not every stage is required for every project.
Table 2. A comprehensive psychometric analysis architecture
Stage | Core question addressed |
|---|---|
1. Study definition | What is being investigated, and why? |
2. Construct architecture | What constructs and subconstructs are proposed? |
3. Demographic architecture | Which grouping variables matter theoretically? |
4. Data screening | Are the data fit for analysis? |
5. Item analysis | Does each item behave sensibly? |
6. Classical test theory | How do observed scores relate to true scores and error? |
7. Exploratory factor analysis | What dimensional structure is suggested by the data? |
8. Confirmatory factor analysis | Does a specified structure fit new or independent data? |
9. Reliability | How precise are the resulting scores? |
10. Validity | What do the scores actually measure? |
11. Measurement invariance | Does the structure hold across groups? |
12. Differential item functioning | Do individual items behave fairly across groups? |
13. Item response theory | How does each item behave along the latent continuum? |
14. Scoring | How should the final scores be computed? |
15. Psychometric report | What is the complete evidence base? |
Not every research project requires every component in Table 2; the appropriate workflow depends on the research purpose, the construct under investigation, the population and sample, the item format, and the intended use of the resulting scores. A screening tool intended for clinical decision making requires a substantially more rigorous evidence base than an exploratory questionnaire used once in a single classroom study. The objective, therefore, is not to perform the largest possible number of analyses, but to perform the analyses necessary to support the intended measurement interpretation, a principle sometimes summarised as proportionate validation and discussed further in Section 19.
4. Defining the Measurement Architecture: Constructs, Subconstructs and Demographic Variables
4.1 Questionnaire architecture
Before uploading data into a psychometric analysis environment, researchers should identify the structure of the questionnaire itself. Treating all items as an undifferentiated list of columns is one of the most common and most consequential errors in applied psychometric practice, because it can produce misleading conclusions about reliability, validity, and the meaning of a total score.
Consider a questionnaire built around three constructs, each with three subconstructs, illustrated in Table 3.
Table 3. Example construct and subconstruct architecture
Construct | Subconstruct 1 | Subconstruct 2 | Subconstruct 3 |
|---|---|---|---|
Digital wellbeing | Digital self-regulation | Psychological balance | Healthy digital engagement |
Digital literacy | Information literacy | Communication literacy | Technical literacy |
Social support | Family support | Peer support | Institutional support |
A modern psychometric platform should allow researchers to specify a hierarchy that moves from study, to constructs, to subconstructs, to items, to demographic variables, and finally to external variables used for validity testing. This hierarchical specification is one of the major distinctions between a basic statistical package, which treats a dataset as an undifferentiated matrix of numbers, and a dedicated psychometric research environment, which understands the measurement meaning of each column.
4.2 Demographic variables as psychometric variables
Demographic variables should not be treated merely as descriptive characteristics to be reported in a sample description table; in a well designed psychometric workflow they are essential inputs to the evaluation itself. Researchers may specify age, sex or gender, education, geographical location, language, occupation, or other theoretically relevant characteristics, and then use these variables to examine whether an instrument behaves consistently across the corresponding subgroups. A researcher measuring digital wellbeing, for example, might compare scores across age groups, gender groups, educational groups, and rural and urban populations, allowing an investigation of whether the instrument functions comparably across populations, which is a precondition for making any substantive claim about group differences. The 2014 Standards explicitly address accessibility, linguistic background, fairness, and emerging technological forms of testing as core concerns for contemporary measurement practice.
5. Data Screening and Item-Level Analysis
5.1 Data screening
Psychometric analysis should always begin with an assessment of data quality, before any structural or inferential analysis is attempted. Researchers should examine sample size, the extent and pattern of missing data, impossible or out of range values, duplicate records, careless or patterned responding, outliers, distributional characteristics, and item response frequencies.
For Likert type items, frequency distributions can reveal problems that are not obvious from means or standard deviations alone. In a hypothetical item with 500 respondents, for example, 260 respondents (52.0 per cent) might select "Strongly agree" and a further 215 (43.0 per cent) "Agree", with only 25 respondents (5.0 per cent) selecting any response below "Agree". Such a distribution suggests substantial concentration at the upper end of the response scale, which may indicate a ceiling effect, socially desirable responding, poorly targeted item difficulty, or an inadequate number of response categories at the favourable end of the construct. Whatever the cause, an item with this distribution will contribute little discriminating information among respondents, and its retention should be reconsidered on psychometric, not merely cosmetic, grounds. Data screening therefore belongs at the very beginning of a psychometric workflow, not as an afterthought once modelling has already begun.
5.2 Item-level analysis
Each item should be examined individually before the researcher evaluates the questionnaire as a complete scale. Useful item level statistics include the mean, standard deviation, median, skewness, kurtosis, minimum, maximum, missingness, response category frequencies, and the corrected item-total correlation. For ordinal items, researchers should pay particular attention to the functioning of individual response categories, since collapsed or rarely used categories can distort subsequent factor analytic and reliability results (Oladunmoye , 2025).
An item should not be retained simply because it produces a desirable mean, nor should it automatically be deleted because it has a non-normal distribution. Psychological constructs are frequently distributed asymmetrically in real populations, and skewness alone is not evidence of poor item functioning. The correct question is not whether an item looks tidy in a descriptive table, but whether the item provides useful information about the construct for the intended population.
Table 4. Illustrative item-level diagnostic panel
Item | Mean | SD | Skewness | Corrected item-total r | Flag |
|---|---|---|---|---|---|
DW1 | 4.31 | 0.68 | -1.42 | .61 | Retain |
DW2 | 4.55 | 0.51 | -1.88 | .38 | Review (low discrimination) |
DW4 | 4.62 | 0.44 | -2.05 | .22 | Review (possible ceiling effect) |
6. Classical Test Theory and Reliability
6.1 Classical test theory
Classical test theory provides a foundational framework for understanding observed scores. The classical model can be represented algebraically as X equals T plus E, where X is the observed score, T is the true score component, and E is measurement error. This deceptively simple equation underlies a great many familiar psychometric statistics, including item-total relationships, internal consistency estimates, and the standard error of measurement, though it is not the entire psychometric universe: modern practice typically supplements it with factor analysis, item response theory, structural equation modelling, multigroup analysis, and differential item functioning analysis, each discussed in later sections.
6.2 Reliability analysis
Reliability should be evaluated only after the researcher has considered the dimensional structure of the instrument. Potential estimates include Cronbach's alpha, McDonald's omega, test-retest reliability, and the intraclass correlation coefficient, and a key organising principle is that reliability should correspond to the score that will actually be interpreted. If a questionnaire contains four subconstructs that will be interpreted separately, reliability should be evaluated for each relevant subscale individually, rather than relying solely on a single overall alpha computed across all items, since a single overall figure can conceal meaningful weaknesses within individual dimensions. The COSMIN framework similarly distinguishes internal consistency from other measurement properties such as reliability, measurement error, structural validity, construct validity, and criterion validity, treating each as a separate strand of evidence rather than a single composite judgement (Mokkink et al., 2010; Oladunmoye, 2015).
A common pattern in multidimensional instruments illustrates the point. Subscale reliabilities might cluster around .74 to .83, comfortably above the conventional .70 threshold for research purposes, while the total scale alpha reaches .94 and looks considerably more impressive. This gap is informative rather than reassuring: a very high total alpha, achieved by pooling items from several distinct subscales, often reflects the sheer number of items combined rather than the coherence of a single underlying construct, and should prompt the researcher to examine dimensionality before treating the total score as the primary outcome.
6.3 Why Cronbach's alpha should not be the final answer
A researcher reporting alpha equal to .94 has not, on its own, established that a scale is psychometrically sound. A high alpha can result partly from having many items, from items that are highly intercorrelated, or from outright item redundancy, none of which is equivalent to genuine measurement quality; alpha also depends on the assumption of essential tau-equivalence, which is frequently violated in practice (Cronbach, 1951). Researchers should therefore ask a series of follow-up questions before treating a high alpha as conclusive: is the scale unidimensional; would omega provide a more informative estimate given violations of tau-equivalence; and are meaningful subscale differences being masked by a high total alpha? Reliability, in short, should be interpreted within the measurement model, rather than in isolation from it.
7. Exploratory Factor Analysis
Exploratory factor analysis (EFA) is appropriate when the underlying dimensional structure of a questionnaire requires empirical exploration, rather than being fully specified in advance. Researchers using EFA typically examine factor retention, factor loadings, cross-loadings, communalities, and factor correlations. Factor retention decisions can incorporate parallel analysis, scree plots, theoretical interpretability, and substantive meaning, used jointly rather than any single criterion in isolation.
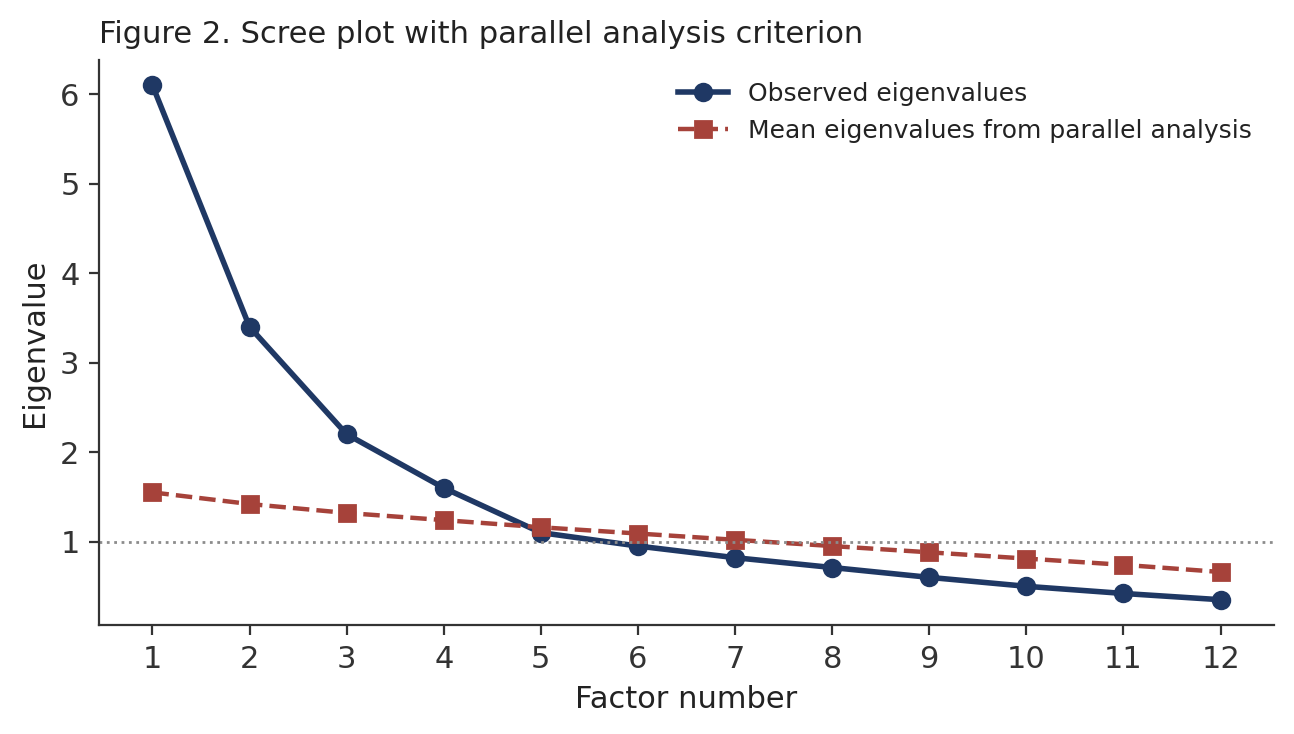
Figure 2. Scree plot with a parallel analysis criterion. Observed eigenvalues are compared against the mean eigenvalues expected from randomly generated data of the same dimensions; factors are typically retained where the observed eigenvalue exceeds the corresponding random eigenvalue.
In Figure 2, the observed eigenvalues exceed the parallel analysis criterion for the first four factors, after which the two curves converge. This pattern would support the retention of a four factor solution, a conclusion that a simple eigenvalue greater than one rule, applied to the observed data alone, would not reliably reproduce.
A major advantage of EFA is that it can reveal whether the observed structure differs from the researcher's initial conceptualisation. For example, a researcher may theorise that psychological resilience comprises three dimensions, but EFA may suggest that the data are better represented by four dimensions. This kind of divergence should trigger theoretical investigation, not automatic statistical acceptance of whichever solution has the most favourable fit statistics.
7.1 EFA should be driven by both theory and data
A purely data-driven approach to factor analysis can produce unstable or substantively meaningless factors, particularly in smaller samples or where items were not written with a clear theoretical structure in mind. A purely theoretical approach, conversely, can ignore genuine empirical evidence about how items actually behave when administered to real respondents. A more defensible approach integrates theory, item content, empirical structure, and substantive interpretation as four mutually informing sources of evidence, rather than treating any one of them as sufficient on its own.
This integrative principle is increasingly emphasised in contemporary scale development guidance. Recent methodological work recommends that domain expertise and careful item evaluation be combined with empirical dimensionality assessment, and that, wherever feasible, EFA and confirmatory factor analysis (CFA) be conducted on different datasets, or at minimum on different subsamples drawn through a planned split-sample design, so that the confirmatory stage genuinely tests the exploratory structure rather than simply re-describing it.
8. Confirmatory Factor Analysis and Competing Measurement Models
Confirmatory factor analysis evaluates a specified measurement model against new or independent data. For example, a researcher might specify that Digital Wellbeing is represented by three first-order factors, namely Digital Self-Regulation, Psychological Balance, and Healthy Digital Engagement, with each subconstruct represented by its corresponding subset of items. Researchers can then examine factor loadings, overall model fit, factor correlations, residual relationships, and, where relevant, competing alternative models.
Commonly reported fit statistics include the chi-square test, the Comparative Fit Index (CFI), the Tucker-Lewis Index (TLI), the Root Mean Square Error of Approximation (RMSEA), and the Standardised Root Mean Square Residual (SRMR). Conventional guidance, following Hu and Bentler (1999), suggests that CFI and TLI values close to or above .95, together with RMSEA values close to or below .06 and SRMR values close to or below .08, are consistent with reasonably good fit under a two-index presentation strategy, although these are properly understood as approximate guidelines rather than strict pass or fail thresholds (Hu & Bentler, 1999; Oladunmoye & Mohammad, 2024).
Fit indices should never be interpreted mechanically. Model adequacy additionally requires theoretical justification for the proposed structure, an estimator appropriate to the level of measurement of the items, sensible parameterisation of the model, and careful examination of plausible alternative explanations for any misfit that is observed.
8.1 Competing measurement models
One of the most powerful uses of CFA is the systematic comparison of plausible alternative models. Suppose a researcher proposes four candidate structures for a 24 item instrument: a one factor model in which all items load on a single general factor (Model A); a three correlated factor model corresponding to the theorised subconstructs (Model B); a second-order model in which the three subconstructs are themselves indicators of a single higher-order factor (Model C); and a bifactor model in which items load simultaneously on a general factor and on their respective specific factors (Model D).
In a typical comparison of this kind, Model A performs conspicuously worse than the three multidimensional alternatives on every fit index reported (for example, CFI of .81 versus .93 to .95, and RMSEA of .11 versus .05 to .06), providing clear evidence against treating the instrument as strictly unidimensional. Models B, C, and D all reach broadly acceptable fit, and the choice among them should not be based on fit statistics alone. The best-fitting model should not automatically be selected without further scrutiny; the selected model must also make substantive and theoretical sense, and must support the specific score interpretation, whether subscale scores, a total score, or both, that the researcher intends to use.
8.2 Reliability within the CFA framework
CFA provides an opportunity to evaluate reliability using the estimated measurement structure itself, rather than relying solely on classical item correlations. For multidimensional scales, researchers can examine omega, composite reliability, factor-specific reliability, and, where appropriate, average variance extracted. This approach is generally more informative than relying exclusively on a single alpha coefficient computed across all items, because it respects the multidimensional structure that CFA has already established. The central question becomes not simply how internally consistent the item pool is, but how much reliable information each intended score, whether a subscale or a total score, actually provides.
9. Validity Evidence: Convergent, Discriminant and Criterion Relationships
9.1 Convergent validity
Suppose a researcher develops a new measure of academic self-efficacy. Theory may predict positive relationships between scores on this new measure and academic engagement, persistence, and achievement motivation. Crucially, the researcher can and should specify these relationships before analysing the data, so that the analysis functions as a genuine test of a prior hypothesis rather than a retrospective search for whatever correlations happen to be statistically significant. Evidence consistent with these pre-specified hypotheses supports the interpretation that the new measure captures the intended construct.
The COSMIN framework emphasises hypothesis testing of this kind as a central part of construct validity evidence, including explicit consideration of the expected direction and expected magnitude of relationships with other variables, not merely their statistical significance (Mokkink et al., 2010; Terwee et al., 2018).
9.2 Discriminant validity
The researcher should also establish that theoretically distinct constructs remain empirically distinguishable from one another. Academic self-efficacy and self-esteem, for instance, are expected to be related, since both concern self-evaluation, but are nonetheless expected to be conceptually different constructs, and evidence should demonstrate that the two measures are not simply interchangeable indicators of the same underlying trait. Useful approaches include comparing factor correlations against a defensible threshold, testing competing CFA models in which the two constructs are alternately merged and separated, the heterotrait-monotrait ratio of correlations (HTMT), and inspection of cross-loadings between item sets. Discriminant validity is especially important when researchers propose several highly related subconstructs within the same instrument, since strong positive manifold among items can otherwise be mistaken for evidence of a coherent, well-differentiated structure when it in fact reflects insufficient conceptual separation between subscales.
9.3 Criterion and predictive evidence
Some instruments are intended to predict or classify an external outcome, for example a selection test intended to predict future job performance, or a screening scale intended to identify a clinically relevant outcome. In such cases, researchers may examine regression, receiver operating characteristic (ROC) analysis, sensitivity, specificity, and overall classification accuracy. Criterion validity, however, requires a defensible criterion: the mere existence of a numerical outcome variable does not automatically make it a valid criterion against which to judge the new instrument, since the criterion itself must have its own credible measurement justification, or the resulting validity evidence will simply transfer whatever weaknesses exist in the criterion onto the instrument under evaluation.
10. Measurement Invariance and Differential Item Functioning
10.1 Measurement invariance
Once the measurement structure has been established, researchers may investigate whether it operates comparably across defined groups, for example men and women, different age bands, or different language versions of the same instrument. Vandenberg and Lance (2000) provide an influential review and synthesis of practice in this area, proposing a stepwise sequence of tests that has since become the standard reference framework for organisational and psychological research (Vandenberg & Lance, 2000).
Table 5. The measurement invariance testing sequence
Level | Constraint imposed | Core question |
|---|---|---|
Configural invariance | Same factor structure across groups, no equality constraints | Is the same pattern of loadings present in each group? |
Metric invariance | Factor loadings constrained equal across groups | Are the loadings comparable across groups? |
Scalar invariance | Intercepts or thresholds additionally constrained equal | Are the intercepts or thresholds sufficiently comparable? |
Strict (residual) invariance | Residual variances additionally constrained equal | Are the residual parameters comparable? |
The precise decision criteria used to judge whether each level of invariance holds, for example changes in CFI of .01 or less between nested models, depend on the measurement model and estimator selected. The broader principle, however, remains constant: group comparisons of latent means or observed scores require evidence that the measurement process itself is sufficiently comparable across groups. Without at least scalar invariance, an observed mean difference between groups is ambiguous, since it could reflect a genuine difference in the underlying construct, a difference in how the instrument functions across groups, or some combination of both.
10.2 Differential item functioning
Measurement invariance operates largely at the level of the construct or the overall model, whereas differential item functioning (DIF) provides a complementary, item-level perspective. If two respondents with comparable levels of the latent trait nonetheless have systematically different probabilities of endorsing one particular item, purely because they belong to different demographic groups, that item may demonstrate DIF. DIF analysis can identify potentially problematic items that would otherwise remain invisible in an aggregate invariance test, and is particularly relevant for cross-cultural research, translated instruments, educational testing, employment assessment, and clinical screening, wherever fairness across subgroups carries direct practical or ethical consequences.
11. Item Response Theory
Item response theory (IRT) provides a different framework for understanding item behaviour. Instead of asking only how strongly a set of items are correlated, IRT asks how the probability of a particular response changes as the respondent's level of the latent trait changes. For dichotomous items, commonly used models include the one, two, three, and four parameter logistic models (1PL, 2PL, 3PL, 4PL); for polytomous Likert type items, commonly used models include the graded response model and the generalised partial credit model. IRT can estimate item characteristics such as discrimination, difficulty or location, item information, and test information, each describing a different aspect of how an item or a full test behaves along the latent continuum.
11.1 Why IRT adds value to scale development
Consider two items with broadly similar factor loadings under classical test theory or CFA. On the basis of loadings alone, both items might appear to perform adequately, yet IRT may reveal that the two items are psychometrically quite different from one another.
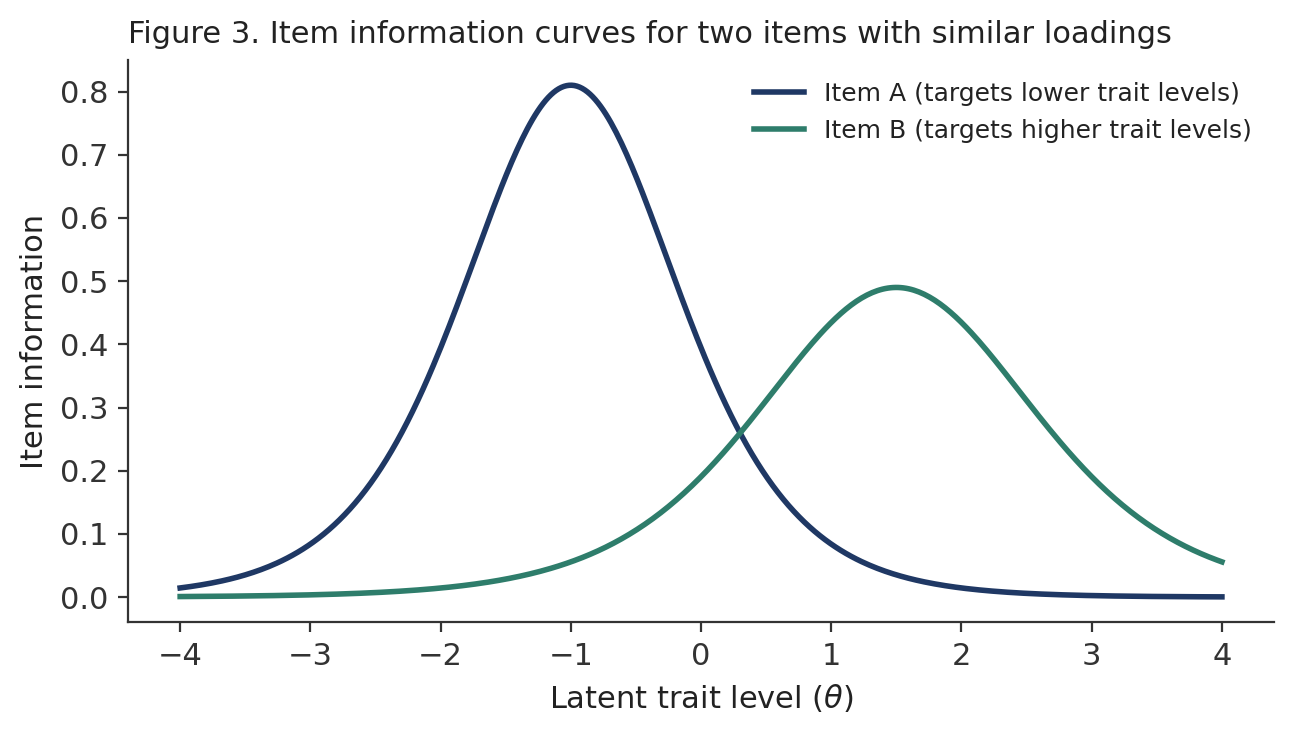
Figure 3. Item information curves for two items with similar factor loadings. Item A provides substantial information for respondents with relatively low levels of the trait, whereas Item B provides substantial information only at relatively high levels of the trait.
As shown in Figure 3, Item A provides substantial information for respondents with relatively low levels of the underlying trait, while Item B provides substantial information only at relatively high trait levels. These are psychometrically different items, despite comparable loadings, and IRT allows researchers to examine where along the latent continuum an instrument is most precise. This distinction becomes particularly important for adaptive testing, screening applications, clinical measurement, ability testing, and short-form development, where the researcher needs to know not just whether an item is good on average, but where its measurement strength lies.
11.2 Test information and measurement precision
IRT also provides information about measurement precision across the entire latent trait continuum, rather than a single averaged reliability figure. A test may be highly precise around the population mean but relatively imprecise at extreme levels of the trait, a pattern that a single overall reliability coefficient cannot reveal. A hypothetical six-item scale, for example, might show its greatest precision, and its smallest standard error of measurement, in the region around theta equals negative 0.5 to 0.2, with precision falling away noticeably towards both extremes of the continuum.
This distinction matters directly when an instrument is used for screening. For example, a depression screening instrument intended to identify individuals at the severe end of a continuum should provide sufficient information in that specific region of the trait, even if this comes at some cost to precision near the population mean. A high overall reliability coefficient, computed without reference to trait level, does not reveal this distribution of precision, and could conceal a screening instrument that performs poorly exactly where it matters most.
11.3 Differential item functioning within IRT
IRT provides powerful tools for examining DIF directly at the level of item parameters. Researchers can investigate whether item discrimination or difficulty parameters differ systematically between groups after controlling for the underlying latent trait, using likelihood ratio tests, Lord's chi-square test, or related approaches. This enables the psychometrician to distinguish true group differences in the construct itself from differences that are created, or amplified, by the measurement instrument. That distinction is central to fair and defensible measurement, particularly in cross-cultural, cross-linguistic, or high-stakes testing contexts.
12. Cross-Cultural Validation and Evidence-Based Item Deletion
12.1 Cross-cultural validation
When a questionnaire crosses countries, languages, cultures, or educational systems, the validation process should be reconsidered rather than assumed to transfer automatically. A translated questionnaire is not automatically a validated questionnaire: researchers may need to examine linguistic equivalence, conceptual equivalence, response processes, factor structure, reliability, measurement invariance, and DIF in each new population before the translated instrument can be used with the same confidence as the original. COSMIN identifies cross-cultural validity as part of the broader construct-validity framework for evaluating measurement instruments, treating it as a distinct measurement property requiring its own dedicated evidence, rather than something that can be inferred from a competent translation alone (Mokkink et al., 2010).
12.2 Evidence-based item deletion and finalising the model
Researchers frequently ask which items should be deleted from a developing scale, and this is not purely a statistical question. An item may reasonably be considered for removal because it demonstrates a poor loading, severe cross-loading, a weak item-total relationship, redundancy with another item, conceptual mismatch with the target construct, or DIF, but item deletion can also damage content coverage if pursued too aggressively. A statistically optimal item pool that no longer represents the full conceptual breadth of the construct is not, in any meaningful sense, an improvement, and an appropriate deletion decision therefore weighs statistical evidence, theoretical relevance, content coverage, and the practical consequences for measurement together, rather than allowing any single statistic to dictate the outcome. At the end of the analysis, researchers should be able to specify, for each score the instrument produces, what construct is being measured, which items represent each dimension, how precise the scores are, what evidence supports their interpretation, and whether the instrument functions comparably across relevant groups: this is the point at which a questionnaire begins to function as a defensible measurement instrument, rather than simply a set of items that happens to produce numbers.
13. The PsychtrixWeb Integrated Workflow
The preceding stages can be translated directly into a modular PsychtrixWeb architecture, in which each analytic stage corresponds to a dedicated module within the platform. Table 6 summarises the modules envisaged for the complete workflow.
Table 6. Proposed PsychtrixWeb modules
Module | Function |
|---|---|
1. Study and Construct Setup | Define project, population, constructs, subconstructs, and theoretical definitions |
2. Questionnaire and Demographic Mapper | Map item codes, wording, response format, reverse scoring, and grouping variables |
3. Data Workspace and Screening | Upload datasets; assess missingness, descriptives, distributions, and outliers |
4. CTT Engine | Item-total statistics, reliability, and item analysis |
5. EFA Engine | KMO, Bartlett's test, factor retention, loadings, and communalities |
6. CFA Engine | Measurement models, fit indices, loadings, and factor correlations |
7. Validity Engine | Convergent, discriminant, and criterion hypothesis testing |
8. Group Comparison and DIF Engine | Measurement invariance, multigroup CFA, and item-level DIF diagnostics |
9. IRT Engine | Item parameters, information functions, and ability estimates |
10. Reporting Engine | APA-style tables, figures, and reproducible psychometric reports |
This modular design allows a researcher to move sequentially from Module 1 through to Module 10, while also permitting a more selective workflow for smaller projects that do not require the full evidence programme, consistent with the proportionality principle introduced in Section 3.
14. Construct Mapping, the Psychometric Data Model, and Automated Diagnostics
14.1 The importance of construct and subconstruct mapping
One of the most important architectural principles underlying PsychtrixWeb is that a questionnaire should not be treated as a flat list of columns. Consider a measure of Organisational Psychological Safety with four subconstructs, namely management openness, interpersonal safety, error tolerance, and employee voice, represented by items OPS1 through OPS24: the psychometric system should understand that each item code maps to a specific subconstruct, and that the subconstructs jointly compose the overarching construct. This mapping enables the researcher to examine both the multidimensional structure of the instrument and the possibility of an overarching general factor, using, for example, a bifactor or second-order model as described in Section 8, which becomes essential when evaluating whether a single total score is defensible or whether subscale scores should be reported separately.
14.2 From flat data to a psychometric data model
A traditional dataset might appear simply as a matrix of item responses (Q1, Q2, Q3...) alongside a small number of demographic columns (Age, Gender), with no information about what each item is actually measuring. A psychometric platform should additionally maintain a parallel metadata table describing the construct, subconstruct, response type, and reverse-scoring status of every item, for example recording that Q1 and Q2 belong to the Resilience construct and the Persistence subconstruct, are scored on a Likert format, and are not reverse-scored, while Q3 belongs to the Recovery subconstruct and is reverse-scored. This metadata transforms raw data into a genuine measurement model, rather than an undifferentiated spreadsheet.
14.3 Automated methodological warnings
A sophisticated psychometric platform should not merely calculate statistics; it should also detect and flag methodological problems as they arise, moving PsychtrixWeb from being a passive calculator toward a genuine psychometric decision-support environment that actively surfaces interpretive problems experienced psychometricians would otherwise have to notice unaided. Four illustrative categories of automated warning follow.
- High alpha, multidimensional structure: total alpha above .90 alongside a factor solution with more than one substantive factor, indicating that a total score may not be theoretically defensible and subscale reliability should be reported.
- EFA and CFA on the same sample: a confirmatory model fitted to the same cases used for exploratory model development, where independent or cross-validation would provide materially stronger evidence.
- Potential differential item functioning: a significant group difference in item parameters after controlling for the latent trait, prompting review of item content and measurement equivalence.
- Weak discriminant evidence: an estimated inter-construct correlation exceeding a pre-specified threshold, for example .85, suggesting constructs may not be empirically distinguishable.
15. The Psychometric Evidence Dashboard and Reproducibility
15.1 A psychometric evidence dashboard
A final instrument could usefully be represented through an evidence dashboard summarising the state of evidence across each relevant domain, as illustrated in Table 9. Reporting an instrument in this way is considerably more informative than the common but largely uninformative claim that a questionnaire was valid and reliable.
Table 9. Example psychometric evidence dashboard
Domain | Evidence source | Status |
|---|---|---|
Content | Expert evaluation | Established |
Structure | Confirmatory factor analysis | Supported |
Reliability | Omega and alpha | Supported |
Convergent and discriminant validity | Hypothesis testing, HTMT | Supported |
Invariance | Multigroup CFA | Partial |
Differential item functioning | Item-level analysis | Two items flagged |
Item response theory | Information functions | Adequate |
A measurement instrument is inherently multidimensional in its evidence base, and a well designed reporting system should preserve, rather than collapse, that multidimensionality. Reducing an entire evidence profile to a single validity score, however tempting for summary purposes, discards precisely the diagnostic detail that a working researcher needs.
15.2 Reproducibility and why it matters for scientific publishing
A modern psychometric system should record analytical decisions as they are made, preserving a complete audit trail of how an instrument evolved. A hypothetical 24 item instrument might, for example, be refined across four recorded versions: Version 1 (24 items) is reduced to Version 2 (20 items) after EFA flags four weak or cross-loading items; Version 2 becomes Version 3 (18 items) once CFA modification indices prompt a further revision; Version 3 becomes the Final Version (17 items) once a measurement invariance test identifies one further item as non-invariant across gender. A researcher who has maintained a proper analysis history of this kind should be able to explain why items were retained or removed, why a particular factor model was selected over its competitors, and how reliability, validity, and group comparability were established, making the resulting evidence considerably more useful to future researchers who can build on a documented foundation rather than repeating validation work from first principles. COSMIN was explicitly developed to support methodological evaluation of measurement-property studies of this kind, and its checklists are now widely used in instrument selection, peer review, study design, and reporting (Mokkink et al., 2010; Terwee et al., 2018).
16. Worked Example: The Digital Resilience Scale
The distinction between statistical and psychometric analysis, emphasised throughout this Research Note, is best illustrated through a worked example. Statistical analysis asks what pattern exists in data; psychometric analysis asks what that pattern tells us about the quality and interpretation of measurement, a difference lying not in the mathematics but in the theoretical commitment and interpretive framework that surrounds it. Consider a hypothetical Digital Resilience Scale comprising 32 Likert-type items, organised around the construct of digital resilience and four proposed subconstructs, namely adaptive coping, recovery, self-regulation, and digital problem solving. The study also collects demographic variables (age, gender, education, location) and external variables intended to support validity testing (digital self-efficacy, psychological wellbeing, and problematic technology use).
Analytic phases follow in sequence, each mapped to its corresponding PsychtrixWeb module: data screening (Module 3); item analysis and classical test theory reliability (Module 4); exploratory factor analysis (Module 5); confirmatory factor analysis together with omega and further reliability estimates (Module 6); convergent and discriminant validity evidence (Module 7); measurement invariance across gender and differential item functioning analysis (Module 8); item response theory analysis and final scoring (Module 9); and, finally, an automated psychometric report (Module 10). The result is what this Research Note terms a measurement evidence portfolio: a coordinated, documented body of evidence covering structure, precision, validity, fairness, and scoring, from which a defensible claim of instrument quality can be constructed and, if necessary, defended under peer review.
17. The Future of Psychometric Software and AI-Assisted Psychometrics
Traditional statistical software is increasingly complemented by specialised analytical environments purpose-built for measurement research. The next generation of psychometric platforms should move toward integrated measurement modelling, reproducibility by default, automated diagnostics of the kind described in Section 14, fairness analysis, adaptive testing, and AI-assisted interpretation, a direction the 2014 Standards themselves anticipated in recognising technological change as an important development affecting testing and assessment. Artificial intelligence can potentially assist researchers with item classification, construct-to-item mapping, duplicate-item detection, and automated reporting, but such recommendations should remain firmly subordinate to psychometric theory and empirical evidence: an AI system might flag two items as semantically redundant on the basis of textual similarity alone, but the researcher must still determine, using theoretical judgement, whether removing one would damage content coverage, a question no textual similarity metric can answer. Working towards this vision, PsychtrixWeb should evolve through a sequence best summarised as define, measure, analyse, validate, compare, diagnose, report, and reproduce, so that a researcher can move from a theoretical construct to a validated instrument within a single coherent environment.
18. Recommended Decision Sequence, Minimal Workflow, and Quality Index
A useful decision sequence for researchers proceeds through nine linked questions, each with an associated remedial action if the answer is no, designed to prevent researchers from jumping directly from questionnaire administration to final statistical conclusions without passing through the intervening evidential steps.
Table 10. Recommended psychometric decision sequence
Question | If the answer is no |
|---|---|
1. Is the construct clearly defined? | Return to conceptualisation |
2. Do the items adequately represent the construct? | Revise the item pool |
3. Do respondents understand the items appropriately? | Revise item wording |
4. Do items demonstrate adequate empirical behaviour? | Investigate item problems |
5. Does the factor structure correspond to theory? | Reconsider the measurement model |
6. Are scores sufficiently reliable? | Investigate measurement precision |
7. Do scores relate to other variables as theory predicts? | Reconsider the validity argument |
8. Does the instrument operate comparably across groups? | Investigate invariance and DIF |
9. Does the final score have a defensible interpretation? | The instrument is not ready for the intended use |
Not every research project needs a fifteen-stage validation programme of the kind summarised in Table 2. For a modest research questionnaire used within a single study, a defensible minimum may include construct definition, item development or selection, content evaluation, data screening, item analysis, structural analysis where appropriate, reliability estimation, validity evidence, transparent scoring, and an explicit statement of limitations. For a new instrument intended for widespread use across multiple studies, populations, or languages, substantially more evidence is generally appropriate; the required level of evidence should correspond to the stakes and intended uses of the resulting scores, a principle sometimes described in the wider measurement literature as proportionate or fit-for-purpose validation. A future PsychtrixWeb system could summarise evidence across domains in the manner already illustrated by the evidence dashboard in Table 9, without reducing psychometric quality to a single, artificial score, preserving the specific location of any remaining weaknesses so that a researcher, reviewer, or downstream user can judge fitness for purpose in relation to their own application.
19. What Researchers Should Avoid, and Concluding Remarks
20.1 What researchers should never do
Drawing together the methodological themes discussed throughout this Research Note, researchers should avoid a recurring set of practices that weaken the credibility of measurement research.
- Treating a high alpha coefficient as proof of validity, rather than as one piece of reliability evidence among several.
- Performing CFA solely to obtain attractive fit indices, rather than to test a genuine, pre-specified theoretical model.
- Deleting items mechanically on the basis of a single statistic, without regard to content coverage.
- Ignoring theoretical definitions when interpreting an empirically derived factor structure.
- Comparing groups on observed or latent scores without first considering measurement invariance.
- Assuming that a competent translation is equivalent to a full validation in the new language or culture.
- Treating an exploratory model as though it had been independently confirmed.
20.2 Conclusion
A questionnaire becomes a defensible psychological measurement instrument through the accumulation of evidence, not through the calculation of any single statistic, however reassuring that statistic might appear in isolation. The process begins with theory and construct definition, and proceeds through item development, content evaluation, data screening, item analysis, structural modelling, reliability estimation, validity testing, measurement invariance, differential item functioning, and, where appropriate, item response theory.
Psychometric analysis is not a collection of unrelated statistical procedures. It is an integrated process for establishing whether observed responses can support meaningful and defensible interpretations of scores.
For PsychtrixWeb, the implication is strategic rather than merely technical. The platform should not be designed as a place where researchers simply upload a CSV file and obtain statistical output; it can instead become a measurement intelligence environment in which researchers define constructs, map subconstructs and items, integrate demographic variables, evaluate psychometric properties, investigate group comparability, identify problematic items, model latent traits, and generate reproducible evidence reports, all within a single coherent workflow. The future of psychometric software is therefore not simply a matter of computing more statistics, faster; it is a matter of achieving better integration of theory, measurement, computation, evidence, and scientific judgement, so that the resulting software genuinely supports, rather than substitutes for, the psychometric reasoning that a defensible measurement claim ultimately requires.
Recommended Citation
Oladunmoye, E. O. (2026). From questionnaire to validated instrument: A complete psychometric analysis workflow using PsychtrixWeb (PsychtrixWeb Research Note No. 005). Psychtrix Initiative Limited.
References
- American Educational Research Association, American Psychological Association, & National Council on Measurement in Education. (2014). Standards for educational and psychological testing. American Educational Research Association.
- Boateng, G. O., Neilands, T. B., Frongillo, E. A., Melgar-Quinonez, H. R., & Young, S. L. (2018). Best practices for developing and validating scales for health, social, and behavioral research: A primer. Frontiers in Public Health, 6, Article 149. https://doi.org/10.3389/fpubh.2018.00149
- Cronbach, L. J. (1951). Coefficient alpha and the internal structure of tests. Psychometrika, 16(3), 297 to 334. https://doi.org/10.1007/BF02310555
- DeVellis, R. F., & Thorpe, C. T. (2021). Scale development: Theory and applications (5th ed.). SAGE Publications.
- Hu, L., & Bentler, P. M. (1999). Cutoff criteria for fit indexes in covariance structure analysis: Conventional criteria versus new alternatives. Structural Equation Modeling, 6(1), 1 to 55. https://doi.org/10.1080/10705519909540118
- Messick, S. (1995). Validity of psychological assessment: Validation of inferences from persons' responses and performances as scientific inquiry into score meaning. American Psychologist, 50(9), 741 to 749. https://doi.org/10.1037/0003-066X.50.9.741
- Mokkink, L. B., Terwee, C. B., Patrick, D. L., Alonso, J., Stratford, P. W., Knol, D. L., Bouter, L. M., & de Vet, H. C. W. (2010). The COSMIN checklist for assessing the methodological quality of studies on measurement properties of health status measurement instruments: An international Delphi study. Quality of Life Research, 19, 539 to 549. https://doi.org/10.1007/s11136-010-9606-8
- Oladunmoye E.O (2025). Ultra-short scales in employee assessment: balancing efficiency and accuracy. Journal of Applied Sciences, Information and Computing.6(2),103-108.
- Oladunmoye, E. O. (2026a). Reliability in Psychological Measurement. PsychtrixWeb Research Note, 004. Psychtrix Initiative Limited. https://www.psychtrixweb.online/research-notes/004abstract-2
- Oladunmoye, E. O. (2026b). Validity in Psychological Assessment: Evidence, Interpretation, and Common Misconceptions. PsychtrixWeb Research Note, 005. Psychtrix Initiative Limited. https://www.psychtrixweb.online/research-notes/005-1-introduction
- Oladunmoye, E. O., (2015). Development and validation of social provision scale on first year undergraduate psychological adjustment. Journal of Education and Practice, 6 (28), 78-90.
- Oladunmoye, E. O., Muhammad T. S., (2024). Development and Validation of Multiple Intelligence Test among emerging adults in the United Kingdom. ISAR Journal of Arts, Humanities and Social Sciences, 2(4), 18-24.
- Oladunmoye, E.O., Oyedele, O. Leah, Enamudu, G.P., and Faith, Nakalema, (2024). Assessing Psychometric Tools in Online Education: Effectiveness and Obstacles in Virtual Learning Assessments. ISAR Journal of Arts, Humanities and Social Sciences, 2(12), 8-13.
- Plake, B. S., & Wise, L. L. (2014). What is the role and importance of the revised AERA, APA, NCME Standards for Educational and Psychological Testing? Educational Measurement: Issues and Practice, 33(4), 4 to 12. https://doi.org/10.1111/emip.12045
- Terwee, C. B., Prinsen, C. A. C., Chiarotto, A., Westerman, M. J., Patrick, D. L., Alonso, J., Bouter, L. M., de Vet, H. C. W., & Mokkink, L. B. (2018). COSMIN methodology for evaluating the content validity of patient-reported outcome measures: A Delphi study. Quality of Life Research, 27, 1159 to 1170. https://doi.org/10.1007/s11136-018-1829-0
- Vandenberg, R. J., & Lance, C. E. (2000). A review and synthesis of the measurement invariance literature: Suggestions, practices, and recommendations for organizational research. Organizational Research Methods, 3(1), 4 to 70. https://doi.org/10.1177/109442810031002
Suggested citation
PhD, E. O. O. (2026). From Questionnaire to Validated Instrument: A Complete Psychometric Analysis Workflow Using PsychtrixWeb. PsychtrixWeb Research Note, 006. Psychtrix Initiative Limited. https://www.psychtrixweb.online/research-notes/006-1-introduction-2Discuss this Research Note
Scholarly comments are welcome from anyone — no account required. Contributions are moderated before they appear.
No comments yet. Start the scholarly discussion below.