
Reliability in Psychological Measurement
Concepts, Estimation, Interpretation and Reporting
Abstract
Reliability is among the most frequently reported psychometric properties of psychological and educational measurement instruments, yet it remains one of the most frequently misunderstood. Investigators routinely cite Cronbach's alpha as evidence that a questionnaire is reliable, at times applying a single numerical threshold as though it were a universal decision rule. Such practice can obscure important distinctions among internal consistency, temporal stability, inter-rater agreement, measurement error and other forms of reliability evidence, and it neglects the fact that reliability is conditional on the scores, the population, the measurement conditions and the intended interpretation. This Research Note provides an expanded, structured treatment of reliability in psychological measurement. It sets out the classical test theory model of observed scores, examines internal consistency, test-retest reliability, inter-rater reliability and split-half reliability, and critically appraises the limitations of Cronbach's alpha. It explains why alpha should not be treated as a universal certificate of scale quality and introduces McDonald's omega as a model-based alternative that is often more defensible under congeneric measurement conditions. The Note further discusses the relationship between reliability and validity, the effects of scale length and inter-item covariance on alpha, multidimensionality, generalisability theory, confidence intervals around reliability estimates, and the necessity of estimating reliability in the actual sample under study rather than relying on figures reported in the original validation work. Particular attention is paid to reliability evidence in cross-cultural and African research contexts. A practical, stage-by-stage reliability-analysis workflow using PsychtrixWeb is proposed, alongside guidance on reporting standards and a catalogue of common reliability errors. The overriding principle advanced throughout is that researchers should select the reliability evidence that corresponds to the specific measurement claim being made, rather than defaulting to a single coefficient by convention. Keywords: reliability; Cronbach's alpha; McDonald's omega; internal consistency; measurement error; test-retest reliability; inter-rater reliability; generalisability theory; psychometrics; scale validation; PsychtrixWeb
1. Introduction
Reliability occupies a foundational place in psychological measurement because researchers rarely, if ever, observe a psychological attribute directly and without error. When a researcher administers a depression questionnaire, the resulting score reflects not only the respondent's underlying level of depressive symptomatology but also characteristics of the items, the conditions of administration, transient psychological states and other sources of measurement error.
Classical test theory (CTT) formalises this relationship in a single, deceptively simple equation:
X = T + E
where X is the observed score, T is the theoretical true-score component, and E is measurement error. Reliability concerns the consistency or precision of measurement under specified conditions; it does not, however, guarantee that the measurement is meaningful.
Reliability is not synonymous with validity. An instrument can generate highly consistent scores while inadequately representing the construct that the researcher intends to measure. Reliability should therefore be treated as one component of a broader psychometric evaluation rather than as a blanket certificate of measurement quality. The Standards for Educational and Psychological Testing identify reliability and precision as central considerations across test development, evaluation, interpretation and use (AERA, APA, & NCME, 2014).
This expanded Research Note situates reliability within that broader argument. It moves beyond a single coefficient to consider the measurement model, the population, the intended score use and the type of evidence that a given research design can actually support.
2. What Does Reliability Mean?
Reliability can be understood broadly as the extent to which measurement is sufficiently consistent or precise for its intended purpose. Different research designs generate different forms of reliability evidence, and each form answers a distinct empirical question. Table 1 summarises the correspondence between common measurement questions and the type of reliability evidence that is relevant to each.
Measurement question | Relevant reliability evidence |
|---|---|
Do items behave consistently within a scale? | Internal consistency (for example, alpha, omega) |
Are scores stable across time? | Test-retest reliability |
Do independent raters agree? | Inter-rater reliability |
Do alternative forms produce comparable scores? | Alternate-form reliability |
How much random measurement error is present? | Measurement error and precision indices (for example, SEM) |
How much of the score variance is attributable to persons, items, raters or occasions? | Generalisability theory (variance components) |
Table 1. Correspondence between measurement questions and reliability evidence.
Consequently, the question "Is the questionnaire reliable?" is incomplete. A more defensible question is: "What type of reliability evidence is required to support the intended score interpretation?" This distinction matters because different reliability coefficients answer different questions, rest on different assumptions, and are appropriate under different measurement models.
3. Internal Consistency and Cronbach's Alpha
Internal consistency concerns the degree to which items intended to contribute to a scale produce sufficiently coherent information. Cronbach's alpha remains the most widely reported index of internal consistency in the psychological literature. Cronbach (1951) developed coefficient alpha as a generalisation of earlier split-half approaches and demonstrated its relationship to inter-item covariance.
For a scale comprising k items, alpha is commonly expressed as:
α = [k / (k − 1)] × [1 − (Σσᵢ² / σˣ²)]
where k is the number of items, σᵢ² is the variance of item i, and σˣ² is the variance of the total score. The coefficient reflects relationships among item responses relative to the variance of the resulting composite score. Its interpretation, however, requires assumptions and contextual judgement that are frequently overlooked in applied research.
4. Why Cronbach's Alpha Should Not Be Treated as a Universal Quality Threshold
A common convention in applied research is to classify alpha coefficients according to fixed numerical bands, as shown in Table 2.
Alpha range | Conventional descriptive label |
|---|---|
α ≥ .90 | Excellent (though possibly redundant items) |
.80 ≤ α < .90 | Good |
.70 ≤ α < .80 | Acceptable |
.60 ≤ α < .70 | Questionable |
α < .60 | Poor |
Table 2. Conventional descriptive bands for Cronbach's alpha (illustrative only; not a universal psychometric standard).
These bands can be useful as rough descriptive conventions, but they should never be treated as universal psychometric laws. An alpha coefficient depends partly on:
- the number of items in the scale;
- the average inter-item covariance;
- the variance of the composite score;
- the dimensionality of the item set;
- characteristics of the sample under study.
Adding more highly correlated items can inflate alpha even when those items contribute little new information. Conversely, a multidimensional scale can sometimes produce a respectable alpha despite not representing a single coherent construct.
A high alpha is not, by itself, sufficient evidence that a scale is unidimensional, valid or fit for its intended purpose.
Researchers should therefore examine a scale's conceptual and structural evidence alongside its reliability estimates, rather than allowing a single coefficient to stand in for the full psychometric argument.
5. Alpha and the Problem of Tau-Equivalence
One important limitation of alpha concerns the assumptions on which it rests. Classical alpha is most straightforwardly interpretable under essential tau-equivalence, that is, when items have equal relationships to the underlying construct (equal factor loadings) and differ only in their error variances. Psychological items routinely violate this assumption because different items typically have different factor loadings on the latent construct.
When tau-equivalence is violated, alpha tends to underestimate true reliability, and the degree of underestimation grows as loadings become more unequal (Dunn, Baguley, & Brunsden, 2014; McNeish, 2018). This is one reason researchers increasingly report alternative reliability estimators, particularly omega. McDonald (1999) developed a broader test-theoretical framework that explicitly accommodates unequal relationships between observed items and latent constructs, removing the tau-equivalence requirement that constrains classical alpha.
The conceptual implication is important: reliability estimation should reflect the measurement model that plausibly generated the data, rather than being selected merely because alpha is conventional or because statistical software defaults to it.
6. McDonald's Omega
McDonald's omega is a model-based reliability coefficient derived from factor-analytic information. For a simple congeneric single-factor model, omega can be represented conceptually as:
ω = (Σλᵢ)² / [(Σλᵢ)² + Σθᵢ]
where λᵢ represents the standardised factor loading of item i, and θᵢ represents the residual (unique) variance of item i. The exact formulation varies according to the reliability model chosen and whether the researcher is estimating total-score reliability, hierarchical (bifactor) reliability, or reliability for a specific subscale.
Omega is particularly useful when items have markedly unequal factor loadings, a condition under which alpha is known to be biased downward (Revelle & Zinbarg, 2009). Figure 2 illustrates, using hypothetical data, how alpha and omega can diverge as the equality of factor loadings deteriorates: alpha declines noticeably as loadings become more unequal, whereas omega remains comparatively stable because it explicitly incorporates the loading structure.
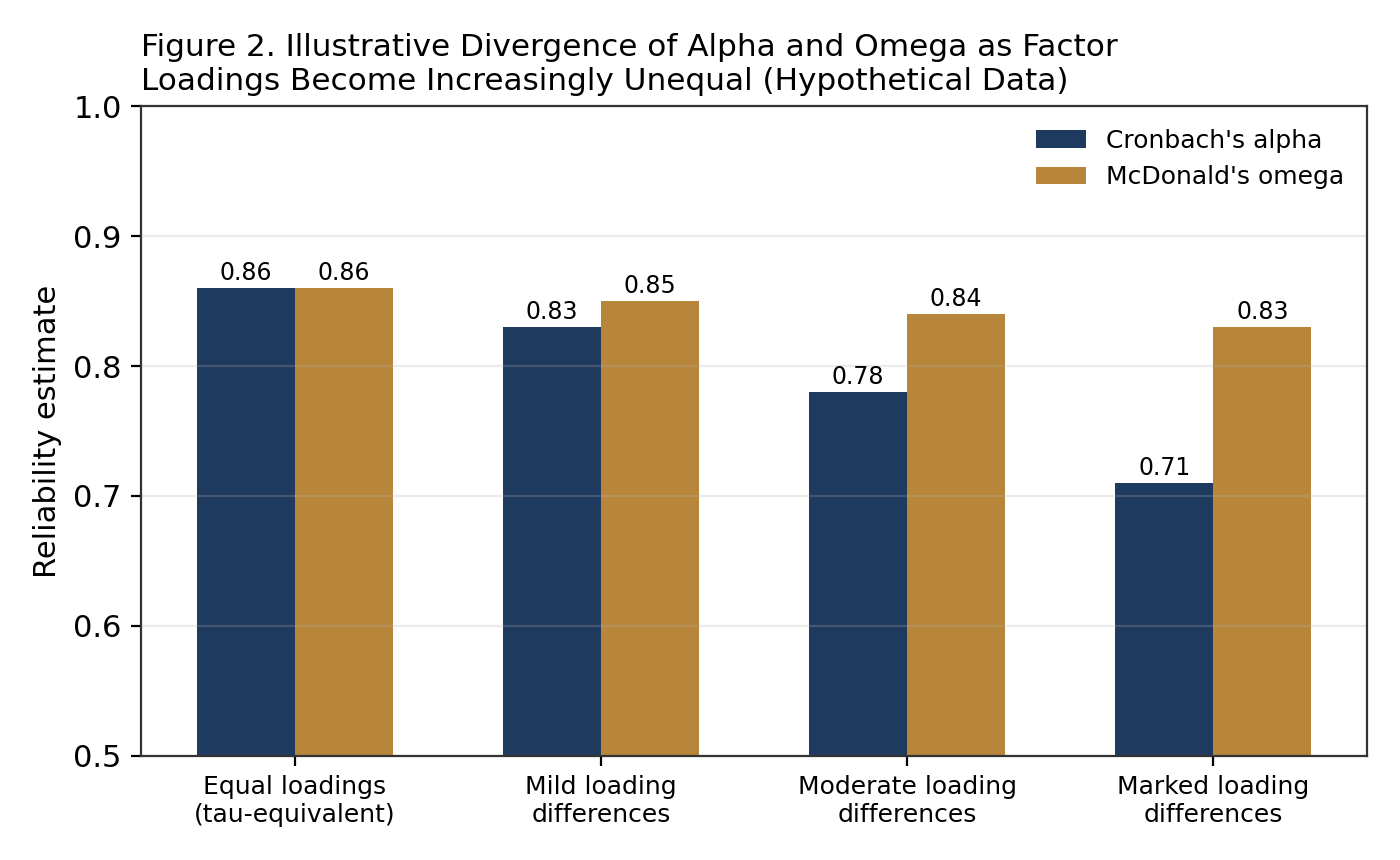
Figure 2. Illustrative divergence of alpha and omega as factor loadings become increasingly unequal (hypothetical data, for pedagogical illustration only).
Researchers should avoid presenting alpha and omega as competing "right versus wrong" statistics. They answer related but distinct questions under different modelling assumptions, and a well-conducted reliability analysis often reports both, together with an explanation of the measurement model that justifies the choice.
7. Extending the Model: An Introduction to Generalisability Theory
Classical test theory treats measurement error as a single undifferentiated quantity. In practice, however, error can arise from multiple, simultaneously operating sources, including items, raters, occasions and testing contexts. Generalisability theory (G-theory) extends CTT by decomposing observed-score variance into distinct variance components attributable to these sources (Brennan, 2001).
A generalisability study (G-study) estimates the relative contribution of each facet, for example person, item and occasion, to total score variance. A subsequent decision study (D-study) then uses these variance components to estimate the reliability that would be expected under alternative measurement designs, such as a different number of items or raters. This approach is especially valuable for rater-mediated assessments, performance-based tasks and clinical observation protocols, where several sources of error operate concurrently and a single alpha coefficient cannot disentangle them.
Although a full G-theory analysis lies beyond the scope of this Note, researchers working with multi-faceted assessment designs, such as structured clinical interviews scored by several raters across multiple occasions, are encouraged to consider it as a complement to classical internal-consistency estimates.
8. Reliability Is Not the Same as Validity
Suppose a researcher develops a fifteen-item questionnaire intended to measure academic resilience, and the questionnaire yields α = .94. That result indicates strong internal consistency. Several questions nonetheless remain unanswered:
- Do the items genuinely represent academic resilience as theoretically defined?
- Is the scale unidimensional, or does it conflate several related constructs?
- Does the hypothesised factor structure fit the observed data?
- Does the scale relate, as expected, to theoretically relevant external constructs?
- Does it distinguish academic resilience from general optimism or self-efficacy?
- Does the instrument function similarly across relevant subgroups (for example, gender, language or institution)?
- Is the resulting score appropriate for the specific decision it will inform?
Reliability is not equal to validity. Reliability contributes to the evidence base but does not, on its own, establish validity.
As discussed in PsychtrixWeb Research Note 001, score interpretation requires a broader measurement argument that integrates content evidence, internal structure, and relationships with external variables (Oladunmoye, 2026a).
9. Reliability and Scale Length
The number of items in a scale directly influences internal consistency. Longer scales often display higher alpha coefficients because alpha incorporates the number of items in its formula. The Spearman-Brown prophecy formula makes this relationship explicit: if a test is lengthened using additional items of comparable quality and inter-item correlation, projected reliability increases according to:
rₙ = (n × r₀) / [1 + (n − 1) × r₀]
where r₀ is the reliability of the original test, n is the factor by which the test is lengthened, and rₙ is the projected reliability of the lengthened test. Figure 1 illustrates this relationship for three starting reliabilities.
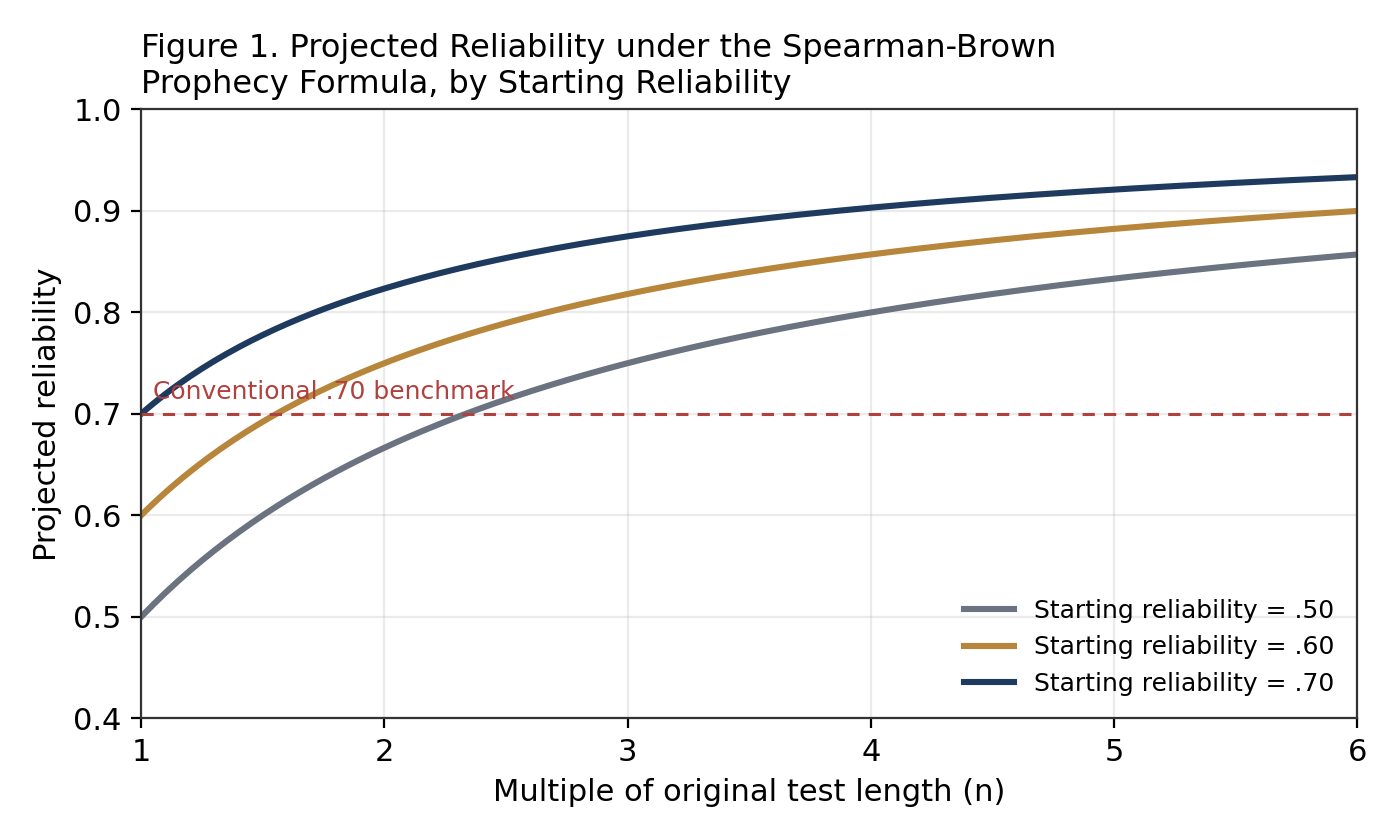
Figure 1. Projected reliability under the Spearman-Brown prophecy formula, by starting reliability.
This relationship carries an important methodological warning: researchers should not simply add redundant items merely to inflate alpha. Consider the illustrative comparison in Table 3.
Scale | Number of items | Alpha | Interpretive comment |
|---|---|---|---|
Scale A | 10 | .78 | Moderate item redundancy; reasonable construct coverage |
Scale B | 30 | .95 | High redundancy; items largely restate similar content |
Table 3. Illustrative comparison of two hypothetical scales with different lengths and alpha coefficients.
Scale B is not necessarily the superior instrument. The researcher must ask whether the additional items broaden construct coverage or simply reproduce existing content at greater respondent burden. Scale development therefore requires a balance among reliability, content coverage, respondent burden, dimensionality, interpretability and validity (DeVellis & Thorpe, 2021; Oladunmoye, 2025).
10. Reliability and Dimensionality
Internal consistency should never be interpreted without reference to dimensionality. Consider a hypothetical questionnaire combining two conceptually distinct dimensions, emotional exhaustion and social withdrawal, into a single twenty-item score. A reasonably high overall alpha does not establish that the resulting composite is unidimensional; it may instead reflect strong covariance within each dimension that happens to inflate the pooled statistic.
Researchers should examine internal structure through appropriate structural methods, including:
- exploratory factor analysis;
- confirmatory factor analysis;
- bifactor modelling;
- item response theory (IRT).
This principle is particularly important for multidimensional psychological instruments. Where subconstructs have been theoretically specified in advance, reliability should generally be examined at the level at which scores are actually interpreted and reported, rather than exclusively at the level of a combined total score.
11. Test-Retest Reliability
Internal consistency addresses relationships among items measured at a single point in time; it does not address whether scores remain stable across time. Test-retest reliability addresses this question of temporal stability. A researcher administers the same instrument at Time 1 and again at Time 2, and estimates the association between the two sets of scores, typically using an intraclass correlation coefficient or a Pearson correlation.
Temporal stability, however, should only be expected when the underlying construct is itself expected to remain stable. For example:
- general intelligence tends to be relatively stable across short-to-moderate intervals;
- personality traits often show substantial, though not perfect, stability;
- acute anxiety may legitimately fluctuate in response to circumstances;
- mood states may vary substantially even over brief intervals;
- outcomes measured before and after a clinical intervention are expected to change.
A low test-retest coefficient is therefore not automatically evidence of poor measurement. The expected temporal stability of the underlying construct, and the length of the retest interval, must always be considered when interpreting the resulting coefficient.
12. Inter-Rater Reliability
When human raters evaluate behaviour, performance, interview responses or clinical presentations, agreement among raters becomes a central concern. Relevant statistics include Cohen's kappa, weighted kappa, intraclass correlation coefficients, and, with appropriate caution, simple percentage agreement.
The appropriate coefficient depends on several design features, summarised in Table 4.
Design feature | Implication for choice of statistic |
|---|---|
Measurement scale (nominal, ordinal, continuous) | Kappa variants suit categorical ratings; ICC suits continuous ratings |
Number of raters (two versus several) | Some ICC forms and Fleiss' kappa generalise to more than two raters |
Categorical or continuous ratings | Determines whether kappa-family or correlation-based statistics apply |
Absolute agreement versus consistency required | Different ICC forms estimate agreement or consistency specifically |
Table 4. Design features that determine the appropriate inter-rater reliability statistic.
A study using clinical ratings, for example, should not automatically default to Cronbach's alpha merely because the rating protocol contains multiple items; the rater, not only the item, is a source of measurement error that alpha does not directly model.
13. Reliability and Measurement Error
Reliability has a direct and quantifiable relationship with measurement precision. One common index is the standard error of measurement (SEM):
SEM = SD × √(1 − r)
where SD is the standard deviation of observed scores and r is the reliability coefficient. The SEM provides an estimate of the uncertainty surrounding an individual observed score and is often more informative for practical interpretation than simply stating that alpha equals .82. Figure 3 illustrates how SEM declines as reliability increases, holding the observed-score standard deviation constant.
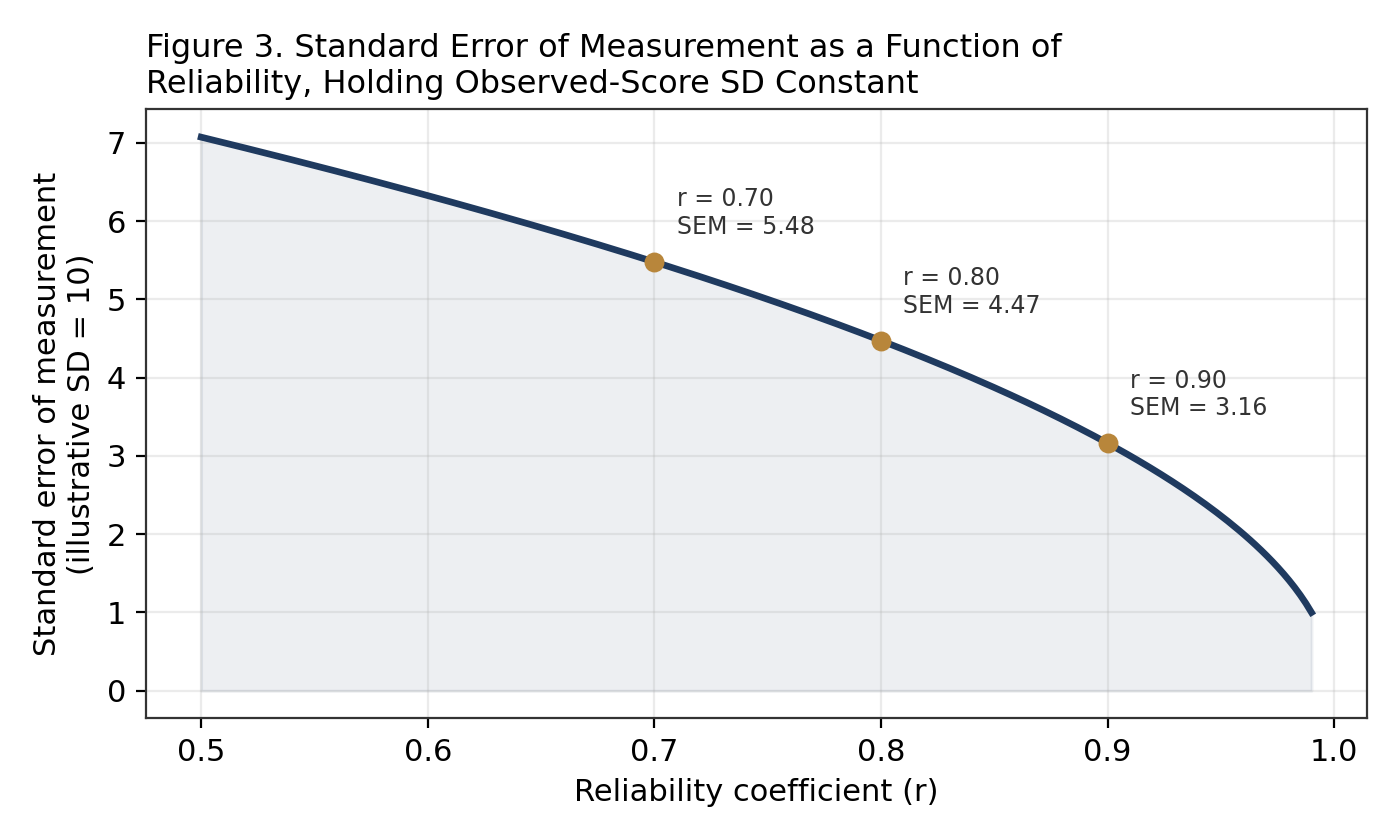
Figure 3. Standard error of measurement as a function of reliability, holding observed-score standard deviation constant (illustrative SD = 10).
A researcher interested in individual-level decisions, such as diagnostic classification or clinical screening, should be especially attentive to measurement error and score precision rather than to the reliability coefficient alone, since the SEM translates directly into the width of a confidence interval around any single respondent's score.
14. Reliability Should Be Estimated in the Study Sample
Researchers sometimes cite a reliability coefficient from the original validation study as though it automatically applies to their own sample. This practice is problematic because reliability is a property of scores obtained under specific conditions, not a fixed property of the instrument itself. Reliability can vary as a function of sample characteristics, score variance, language, culture, administration conditions, population and item functioning.
When a researcher uses an existing instrument, good practice requires reporting relevant reliability evidence from the current dataset alongside the historical figure. For example, stating that "the original validation study reported α = .86" is useful historical context, but the present study should also report that "in the present sample, α = .82 and ω = .84." The two pieces of evidence answer different, complementary questions and neither substitutes for the other.
15. Reliability in Cross-Cultural Research
A scale can demonstrate adequate reliability in one cultural context while behaving differently in another. Translation alone does not guarantee measurement equivalence. Cross-cultural adaptation should consider linguistic equivalence, conceptual equivalence, cultural relevance, response processes, internal structure, reliability, validity, measurement invariance and potential differential item functioning (DIF).
This is especially important for researchers applying instruments developed in Western populations to African contexts, where item content, response styles and underlying construct structures may not transfer directly. Reliability should therefore be treated as context-dependent evidence rather than as a permanent characteristic of an instrument. Reporting reliability separately for the specific population, language and administration context under study is essential good practice in cross-cultural and African psychometric research.
16. A Recommended Reliability Workflow
A robust reliability analysis can follow the eight-stage sequence summarised in Table 5.
Stage | Task | Key considerations |
|---|---|---|
1 | Define the score | Specify precisely what the resulting score is intended to represent |
2 | Establish dimensionality | Determine whether items represent one dimension, several dimensions, or a general factor plus specific factors |
3 | Examine item quality | Inspect missing data, item distributions, item-total relationships and problematic response patterns |
4 | Estimate internal consistency | Select alpha, omega or another coefficient consistent with the measurement model |
5 | Examine temporal stability | Where theoretically appropriate, estimate test-retest reliability |
6 | Examine rater agreement | For rater-based measures, apply an appropriate inter-rater statistic |
7 | Examine measurement error | Report SEM, confidence intervals and, where relevant, classification consistency |
8 | Interpret in context | Avoid relying on a numerical threshold alone; integrate with structural and validity evidence |
Table 5. Recommended eight-stage reliability-analysis workflow.
17. Reliability Analysis Using PsychtrixWeb
PsychtrixWeb can operationalise reliability analysis as part of a broader measurement workflow. A researcher could upload questionnaire data and define a construct, for example Psychological Wellbeing, together with its theoretically specified subconstructs, such as Emotional Wellbeing, Social Wellbeing and Psychological Functioning. The platform then treats each subconstruct as a distinct measurement unit rather than automatically combining all items into a single composite score.
Table 6 summarises the recommended sequence of stages within the platform.
Sequence | Platform stage |
|---|---|
1 | Data upload |
2 | Demographic definition |
3 | Construct definition |
4 | Subconstruct definition |
5 | Item assignment |
6 | Item analysis |
7 | Alpha estimation |
8 | Omega estimation |
9 | Item diagnostics |
10 | Factor structure examination |
11 | Validity analysis |
Table 6. Recommended PsychtrixWeb reliability-analysis sequence.
This architecture is preferable to a simple, isolated "calculate Cronbach's alpha" tool because it situates reliability within the larger psychometric argument, linking construct definition, item-level diagnostics, factor structure and validity evidence within a single, traceable workflow.
18. What Researchers Should Report
A complete reliability report should identify the ten elements listed in Table 7.
No. | Element |
|---|---|
1 | Instrument name |
2 | Construct measured |
3 | Number of items |
4 | Number of participants |
5 | Scoring method |
6 | Reliability coefficient(s) |
7 | Confidence interval, where available |
8 | Relevant assumptions |
9 | Dimensionality evidence |
10 | Substantive interpretation |
Table 7. Recommended elements of a complete reliability report.
For example, a well-constructed report might state:
"The twelve-item Academic Resilience Scale demonstrated acceptable internal consistency in the present sample, with McDonald's omega of .86 and Cronbach's alpha of .84. Confirmatory factor analysis supported the hypothesised one-factor structure, and reliability estimates were interpreted in conjunction with structural and validity evidence."
This is considerably stronger, and more informative, than the bare assertion that "the scale was reliable because Cronbach's alpha was .84."
19. Common Reliability Errors
Common claim | Verdict | Correction |
|---|---|---|
"Alpha above .70 means the scale is valid." | False | Alpha addresses internal consistency only; validity requires separate structural, convergent and criterion-related evidence. |
"Alpha above .90 is always better." | False | Very high alpha can indicate item redundancy rather than superior measurement. |
"Cronbach's alpha proves unidimensionality." | False | Dimensionality requires structural evidence such as factor analysis, not inference from alpha alone. |
"The original validation alpha is enough." | Not necessarily | Reliability should generally be evaluated in the current sample when feasible. |
"Every scale needs alpha." | Not necessarily | Different measurement designs require different reliability approaches (for example, kappa for rater agreement). |
"Test-retest reliability should always be high." | Not necessarily | Expected stability depends on the construct's theoretical stability and the retest interval. |
"Reliability is a permanent property of an instrument." | False | Reliability is evidence about scores obtained under specified conditions, not a fixed trait of the instrument. |
Table 8. Common reliability errors and their corrections.
20. Reliability as Part of a Larger Psychometric System
Reliability should be interpreted alongside construct definition, content evidence, internal structure, convergent evidence, discriminant evidence, criterion-related evidence, measurement invariance, differential item functioning, measurement error and the intended use of the resulting scores. This broader perspective prevents researchers from reducing overall psychometric quality to a single coefficient.
A well-developed instrument should therefore answer two broad questions, summarised in Table 9.
Question | Concern addressed |
|---|---|
Are the scores sufficiently precise and consistent? | Reliability |
Do the scores support the intended interpretation and use? | Validity |
Table 9. The two broad questions that a well-developed instrument must answer.
Both questions are necessary, and neither is sufficient on its own.
21. Conclusion
Reliability is essential to psychological measurement, but it should not be reduced to a single figure such as Cronbach's alpha. A sophisticated reliability evaluation considers the nature of the construct, the measurement model, dimensionality, the population, administration conditions, temporal stability, rater effects and measurement error.
Cronbach's alpha remains historically important and widely useful, but researchers should recognise its assumptions and limitations, particularly its dependence on tau-equivalence. McDonald's omega and other model-based approaches, together with generalisability theory for multi-faceted designs, can provide complementary information when the measurement structure warrants them.
Choose the reliability evidence that corresponds to the measurement claim you are making.
PsychtrixWeb can support this approach by integrating reliability analysis with construct definition, subconstruct specification, item analysis, factor analysis, validity assessment, measurement invariance and differential item functioning, rather than treating reliability as an isolated calculation performed in isolation from the rest of the psychometric argument.
The next Research Note in this series will examine validity in greater depth, moving from the question of score consistency to the more fundamental question of whether interpretations made from scores are scientifically defensible (Oladunmoye, 2026b).
Recommended Citation
Oladunmoye, E. O. (2026). Reliability in psychological measurement: Concepts, estimation, interpretation and reporting (PsychtrixWeb Research Note No. 002, Expanded Edition). Psychtrix Initiative Limited.
References
- American Educational Research Association, American Psychological Association, & National Council on Measurement in Education. (2014). Standards for educational and psychological testing. American Educational Research Association.
- Brennan, R. L. (2001). Generalizability theory. Springer.
- Cronbach, L. J. (1951). Coefficient alpha and the internal structure of tests. Psychometrika, 16(3), 297-334. https://doi.org/10.1007/BF02310555
- DeVellis, R. F., & Thorpe, C. T. (2021). Scale development: Theory and applications (5th ed.). SAGE Publications.
- Dunn, T. J., Baguley, T., & Brunsden, V. (2014). From alpha to omega: A practical solution to the pervasive problem of internal consistency estimation. British Journal of Psychology, 105(3), 399-412. https://doi.org/10.1111/bjop.12046
- McDonald, R. P. (1999). Test theory: A unified treatment. Lawrence Erlbaum Associates.
- McNeish, D. (2018). Thanks coefficient alpha, we'll take it from here. Psychological Methods, 23(3), 412-433. https://doi.org/10.1037/met0000144.
- Oladunmoye E.O (2025). Ultra-short scales in employee assessment: balancing efficiency and accuracy. Journal of Applied Sciences, Information and Computing.6(2),103-108.
- Oladunmoye, E. O. (2026a). Understanding psychometric measurement: Constructs, variables, scores, and measurement error (PsychtrixWeb Research Note No. 001). Psychtrix Initiative Limited.
- Oladunmoye, E. O. (2026b). Validity in psychological measurement: Evidence, argument, and interpretation (PsychtrixWeb Research Note No. 003). Psychtrix Initiative Limited.
- Revelle, W., & Zinbarg, R. E. (2009). Coefficients alpha, beta, omega, and the glb: Comments on Sijtsma. Psychometrika, 74(1), 145-154. https://doi.org/10.1007/s11336-008-9102-z
- Tavakol, M., & Dennick, R. (2011). Making sense of Cronbach's alpha. International Journal of Medical Education, 2, 53-55. https://doi.org/10.5116/ijme.4dfb.8dfd
Suggested citation
Oladunmoye, E. O. (2026). Reliability in Psychological Measurement. PsychtrixWeb Research Note, 004. Psychtrix Initiative Limited. https://www.psychtrixweb.online/research-notes/004-abstract-2Discuss this Research Note
Scholarly comments are welcome from anyone — no account required. Contributions are moderated before they appear.
No comments yet. Start the scholarly discussion below.